Australia


Chart of the week
Figure 1:Outperformance of cyclical assets suggests manufacturing recovery to continue
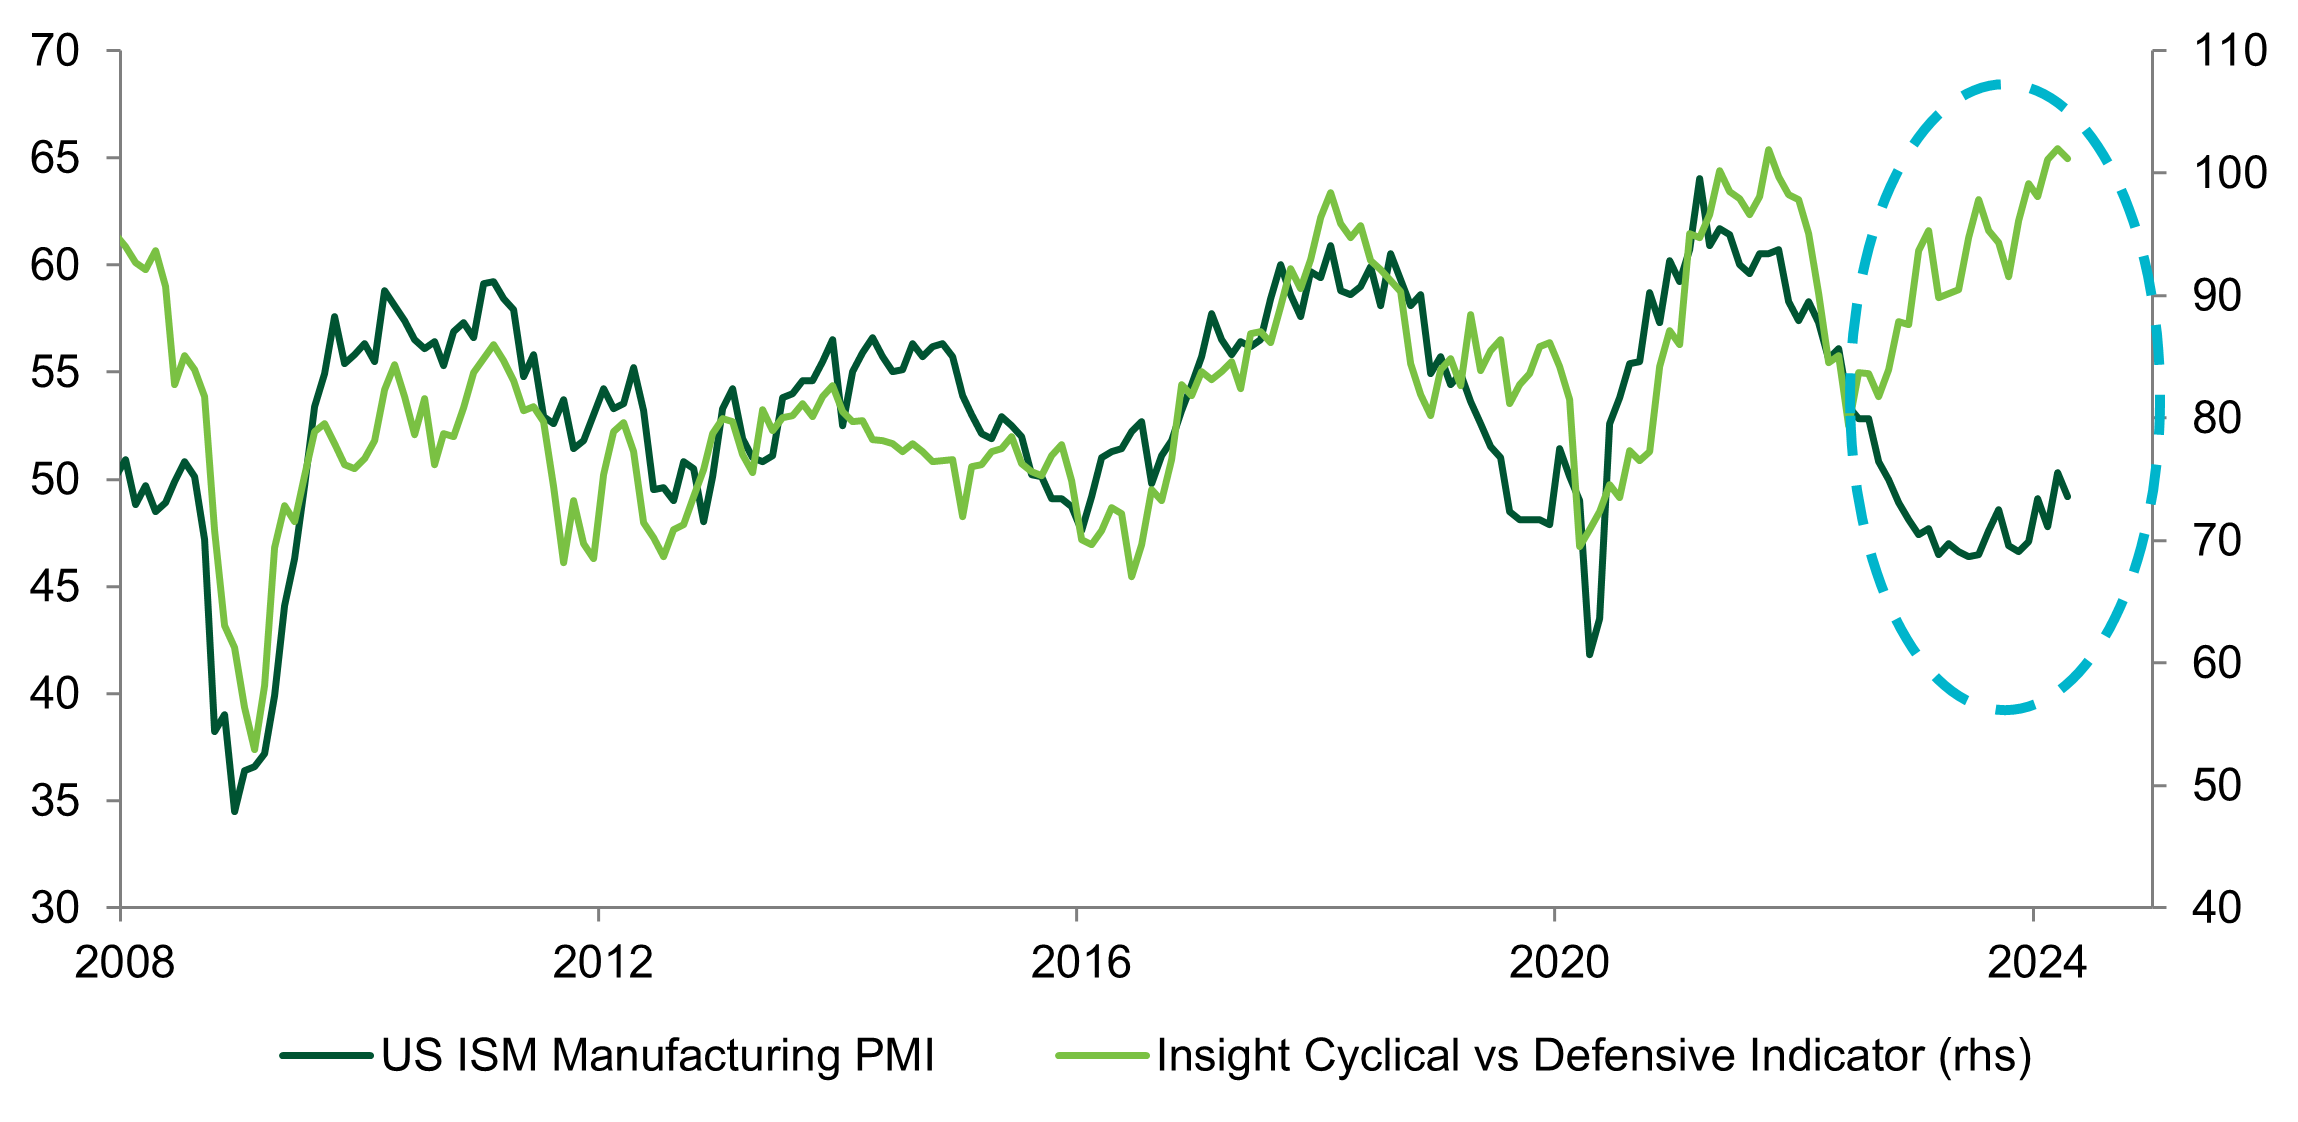
Source: Insight Investment and Bloomberg as at 15 May 2024.
- This week’s chart looks at the strong relationship between US manufacturing and the equity performance of cyclically sensitive companies relative to defensive companies.
- We have noted for a while that manufacturing PMIs (one of our preferred indicators of global growth) have been slowly recovering from the lows of 2023. That said, the latest US ISM Manufacturing PMI did surprise to the downside, but the relative outperformance of cyclical companies suggests that this could be a temporary blip.
Market watch
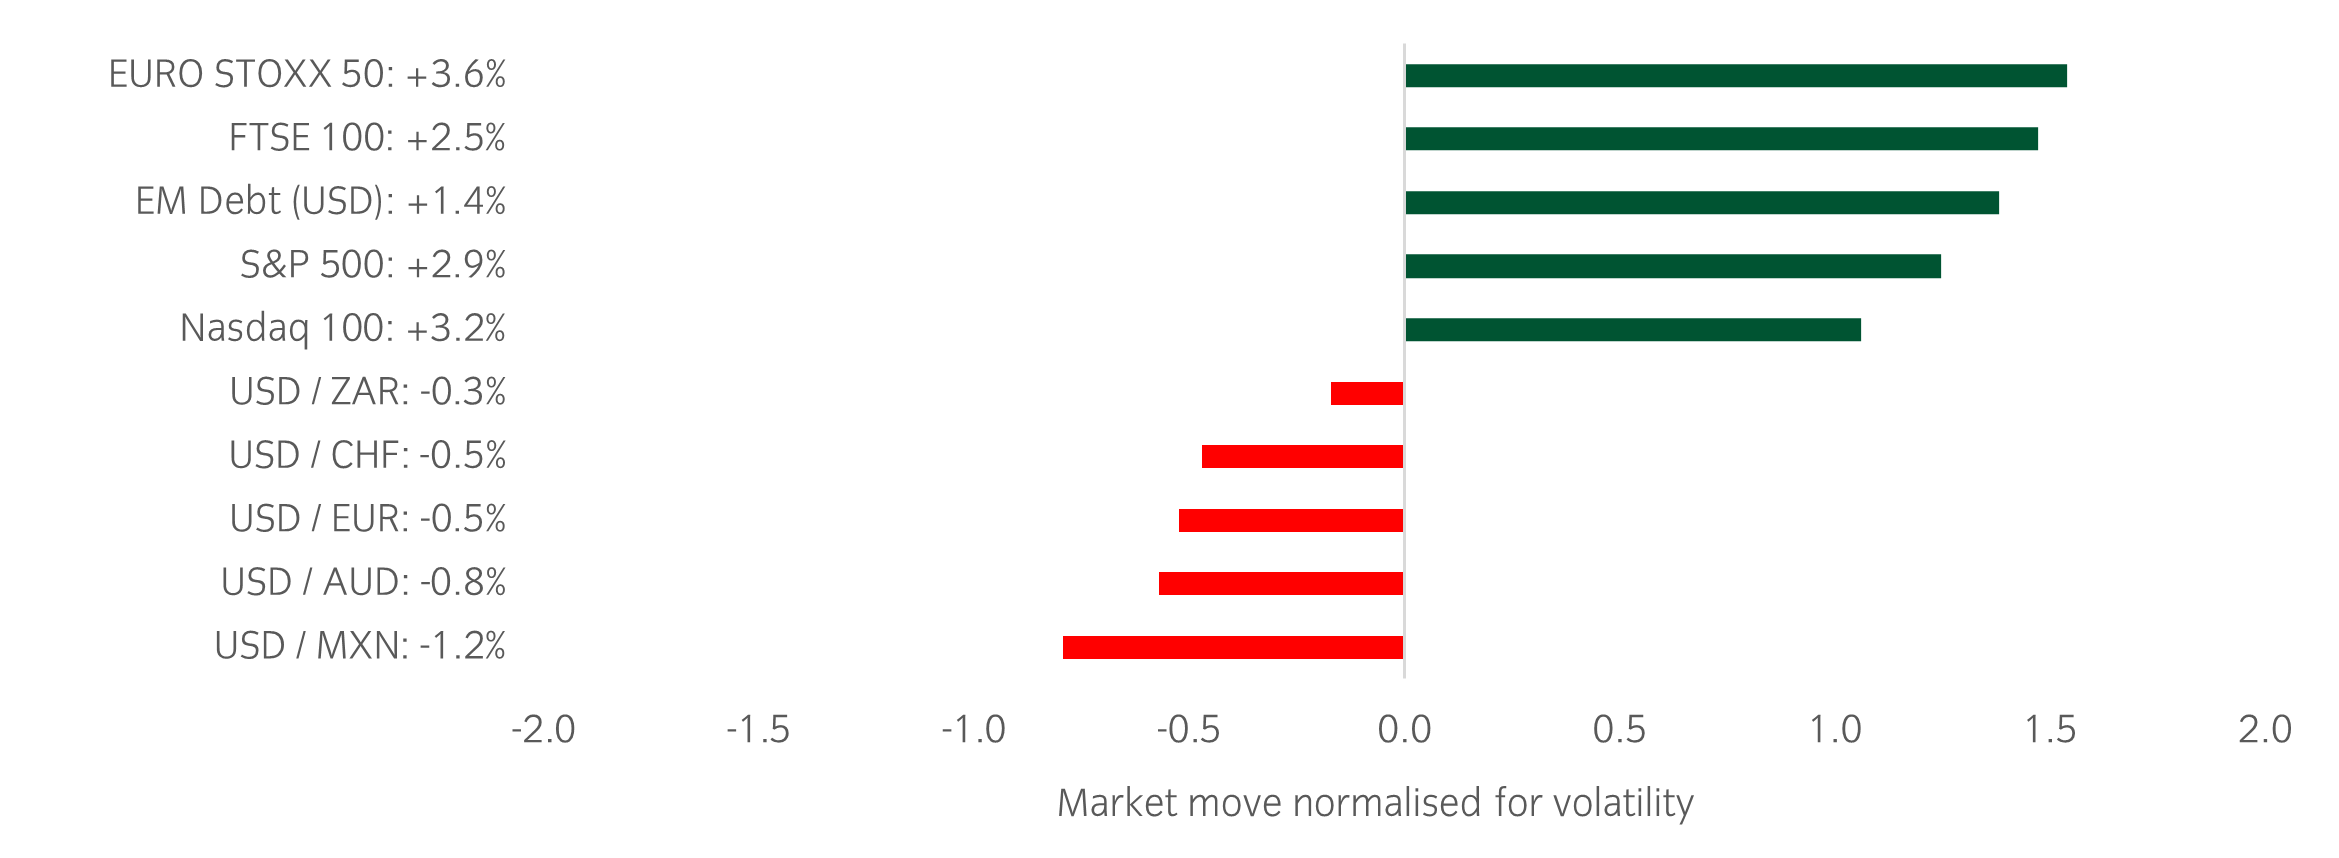
Figure 2:
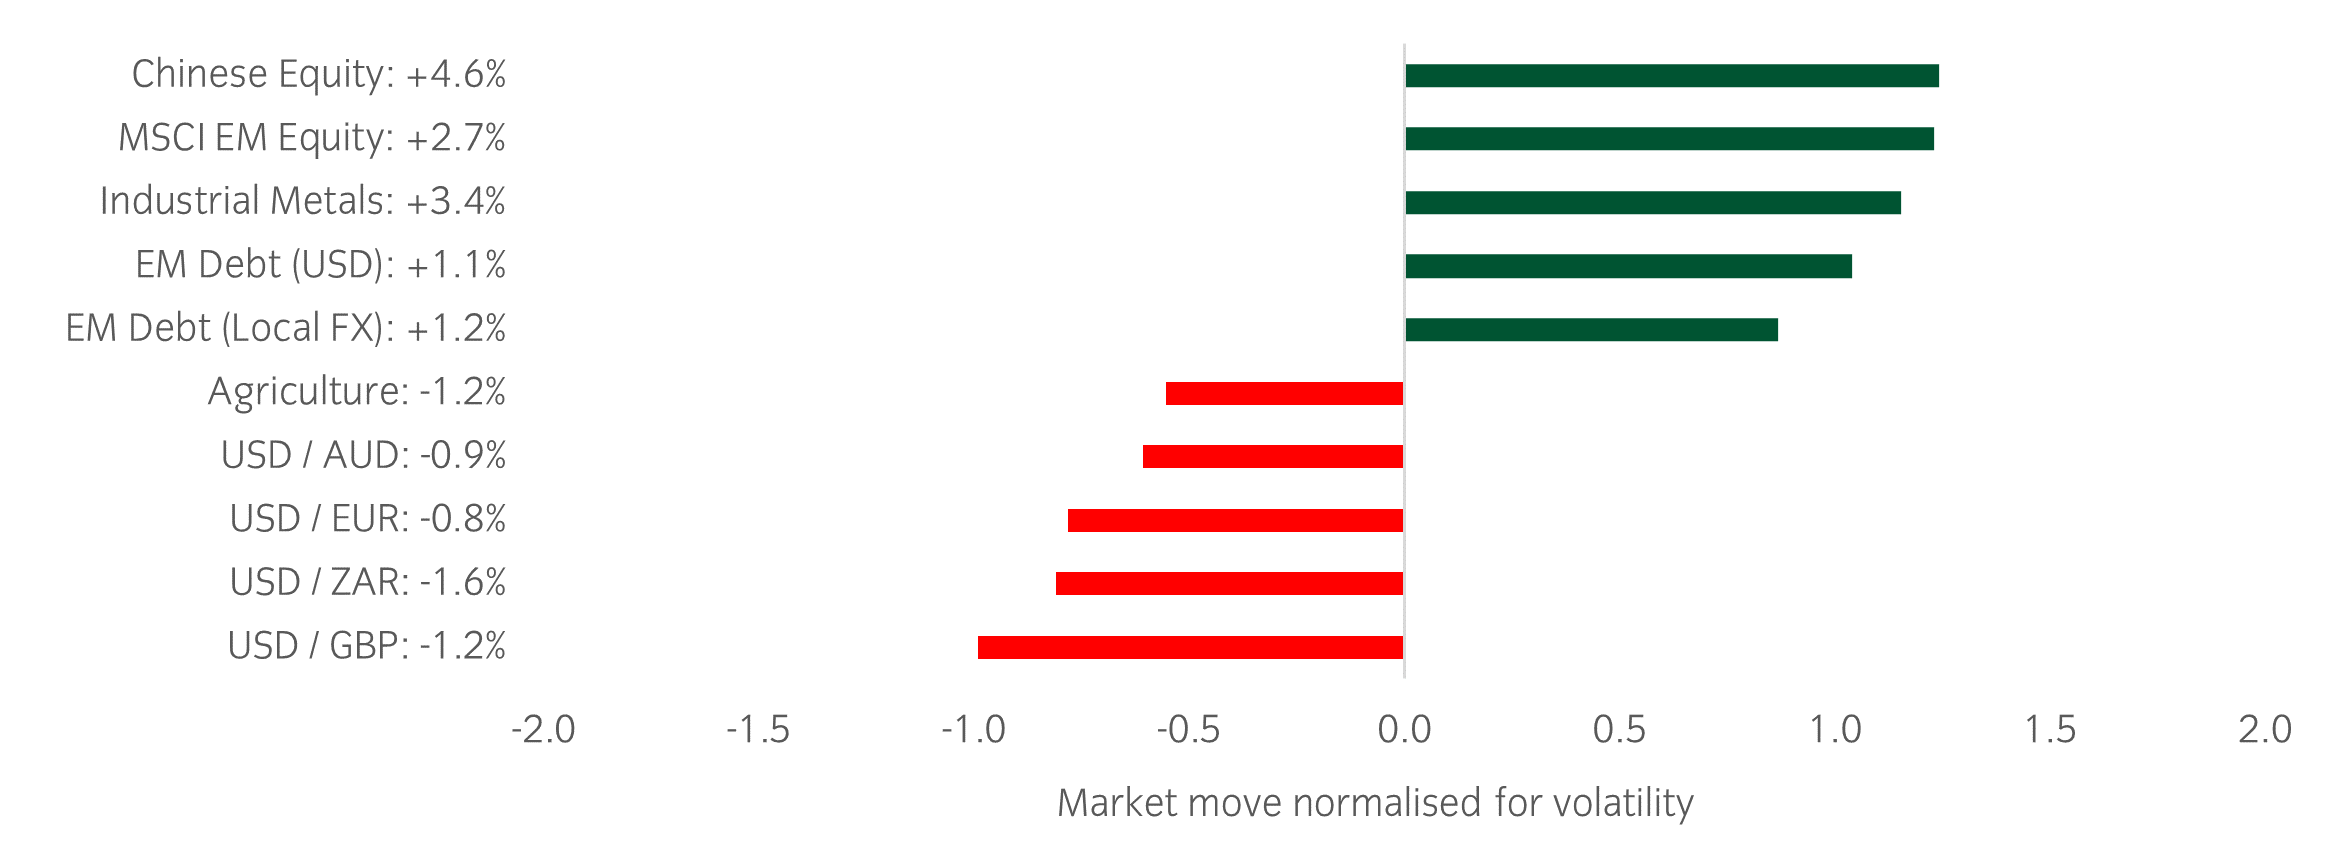
Source: Bloomberg and Insight as at 17 May 2024. The price movement of each asset is shown next to its name. The data used by the bar chart divides the price movement by the annualised historical volatility of each asset.
Over the past week, three things caught our eye:
- US CPI came in-line with expectations – this was a relief for equity markets after several months of upside CPI surprises. On the margin, markets were comfortable pricing in a higher probability of Fed rate cuts by the end of 2024.
- It has been a busy week for Chinese earnings, with several megacap stocks such as Tencent, Alibaba, JD. com and Baidu reporting. Results were generally positive relative to expectations, and this has helped Chinese equities to rally.
- China announced new efforts to support the domestic property market. These include reducing minimum downpayments, relaxing mortgage rules and encouraging local governments to buy unsold homes – all attempts to boost demand and reduce excess housing inventory. Shares for Chinese property developers rallied but the final impact on the Chinese economy will depend on the specific details of the new policies.
Winners & losers: Winners & losers: equities and government bonds broadly rallied while the USD weakened.
Asset allocation observation
Figure 3: Regional breadth in equity markets
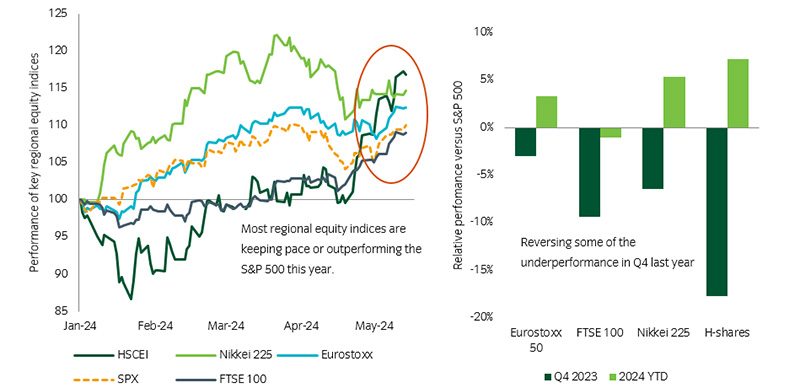
Source: Insight and Bloomberg as at 17 May 2024.
- We have previously highlighted how the most recent earnings season brought strong beats versus consensus across a number of regions. This week’s asset allocation observation highlights that this regional breadth is also being reflected in equity market returns so far this year.
- While the equity market narrative continues to revolve around the ‘Magnificent 7’ driving S&P 500 returns, we have actually seen strong outperformance versus the S&P 500 for European, Japanese and Chinese equities. Even the UK equity market has broken strongly to new highs and is matching pace with the US equity market.
Chart of the week
Figure 1:Chart of the week: Global corporate earnings growth improves and shows regional breadth
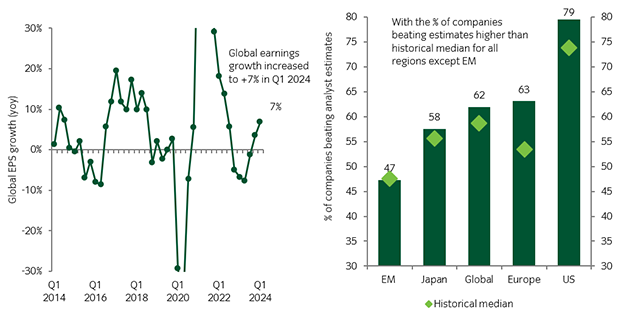
Source: Deutsche Bank, Insight and Bloomberg as at 07 May 2024.
- After a modest earnings recession, which began in Q4 2022, global corporate earnings growth has started to improve. The blended growth of earnings across the major US, Japan, Europe and emerging market (EM) indices is currently running at +7% year-on-year.
- While US earnings growth has been primarily driven by the large megacap firms, we are seeing signs that the better growth environment is leading to a broadening out in corporate strength.
- Indeed, there was a higher percentage of companies beating analyst estimates than the historical median across all regions except EM (where Chinese corporates are still struggling). Furthermore, the beats were largely driven by improving margins, which often has a positive lead on the business cycle.
Market watch
Figure 2:
Source: Bloomberg and Insight as at 10 May 2024. The price movement of each asset is shown next to its name. The data used by the bar chart divides the price movement by the annualised historical volatility of each asset.
Over the past week, three things caught our eye:
- Some softer than expected US job data allowed government bond yields to continue to fall from their late April highs. This in turn has contributed to a strong week for equity markets which had become adversely impacted by the speed of the move higher in bond yields during April. The softer US data also explains why the USD has been weaker over the past week.
- Although the US earnings season is almost finished it has been a busy week for European earnings. Results have generally been better than expected (see above) and helped drive European equities higher. Next week is a particularly busy week for Chinese earnings with several megacap stocks due to report (i.e. Tencent, Alibaba, JD.com and Baidu).
- The Swedish central bank cut rates on Wednesday and became the second G10 country to start an easing cycle. The European Central Bank is widely expected to cut rates at its meeting on 6 June. The Bank of England, however, kept the rates on hold as expected but in the following press conference, Governor Bailey sounded relatively dovish stating that the reductions in bank rate could be “possibly more so than currently priced into market rates”. This raised expectations for a cut at the next meeting in June which the market is now pricing with a probability of 63%.
Winners & losers: This week was relatively quiet in terms of news flow and this was reflected in low trading volumes across a number of equity markets. Despite this, there was a broad equity market rally as the headwind from rising bond yields subsided. The more positive risk tone and the softness of the USD meant that emerging market debt had a particularly strong week. The main loser on the week was the USD, which has been very strong this year due to the strength of US growth and inflation data.
Asset allocation observation
Figure 3: Chinese equities trying to breakout
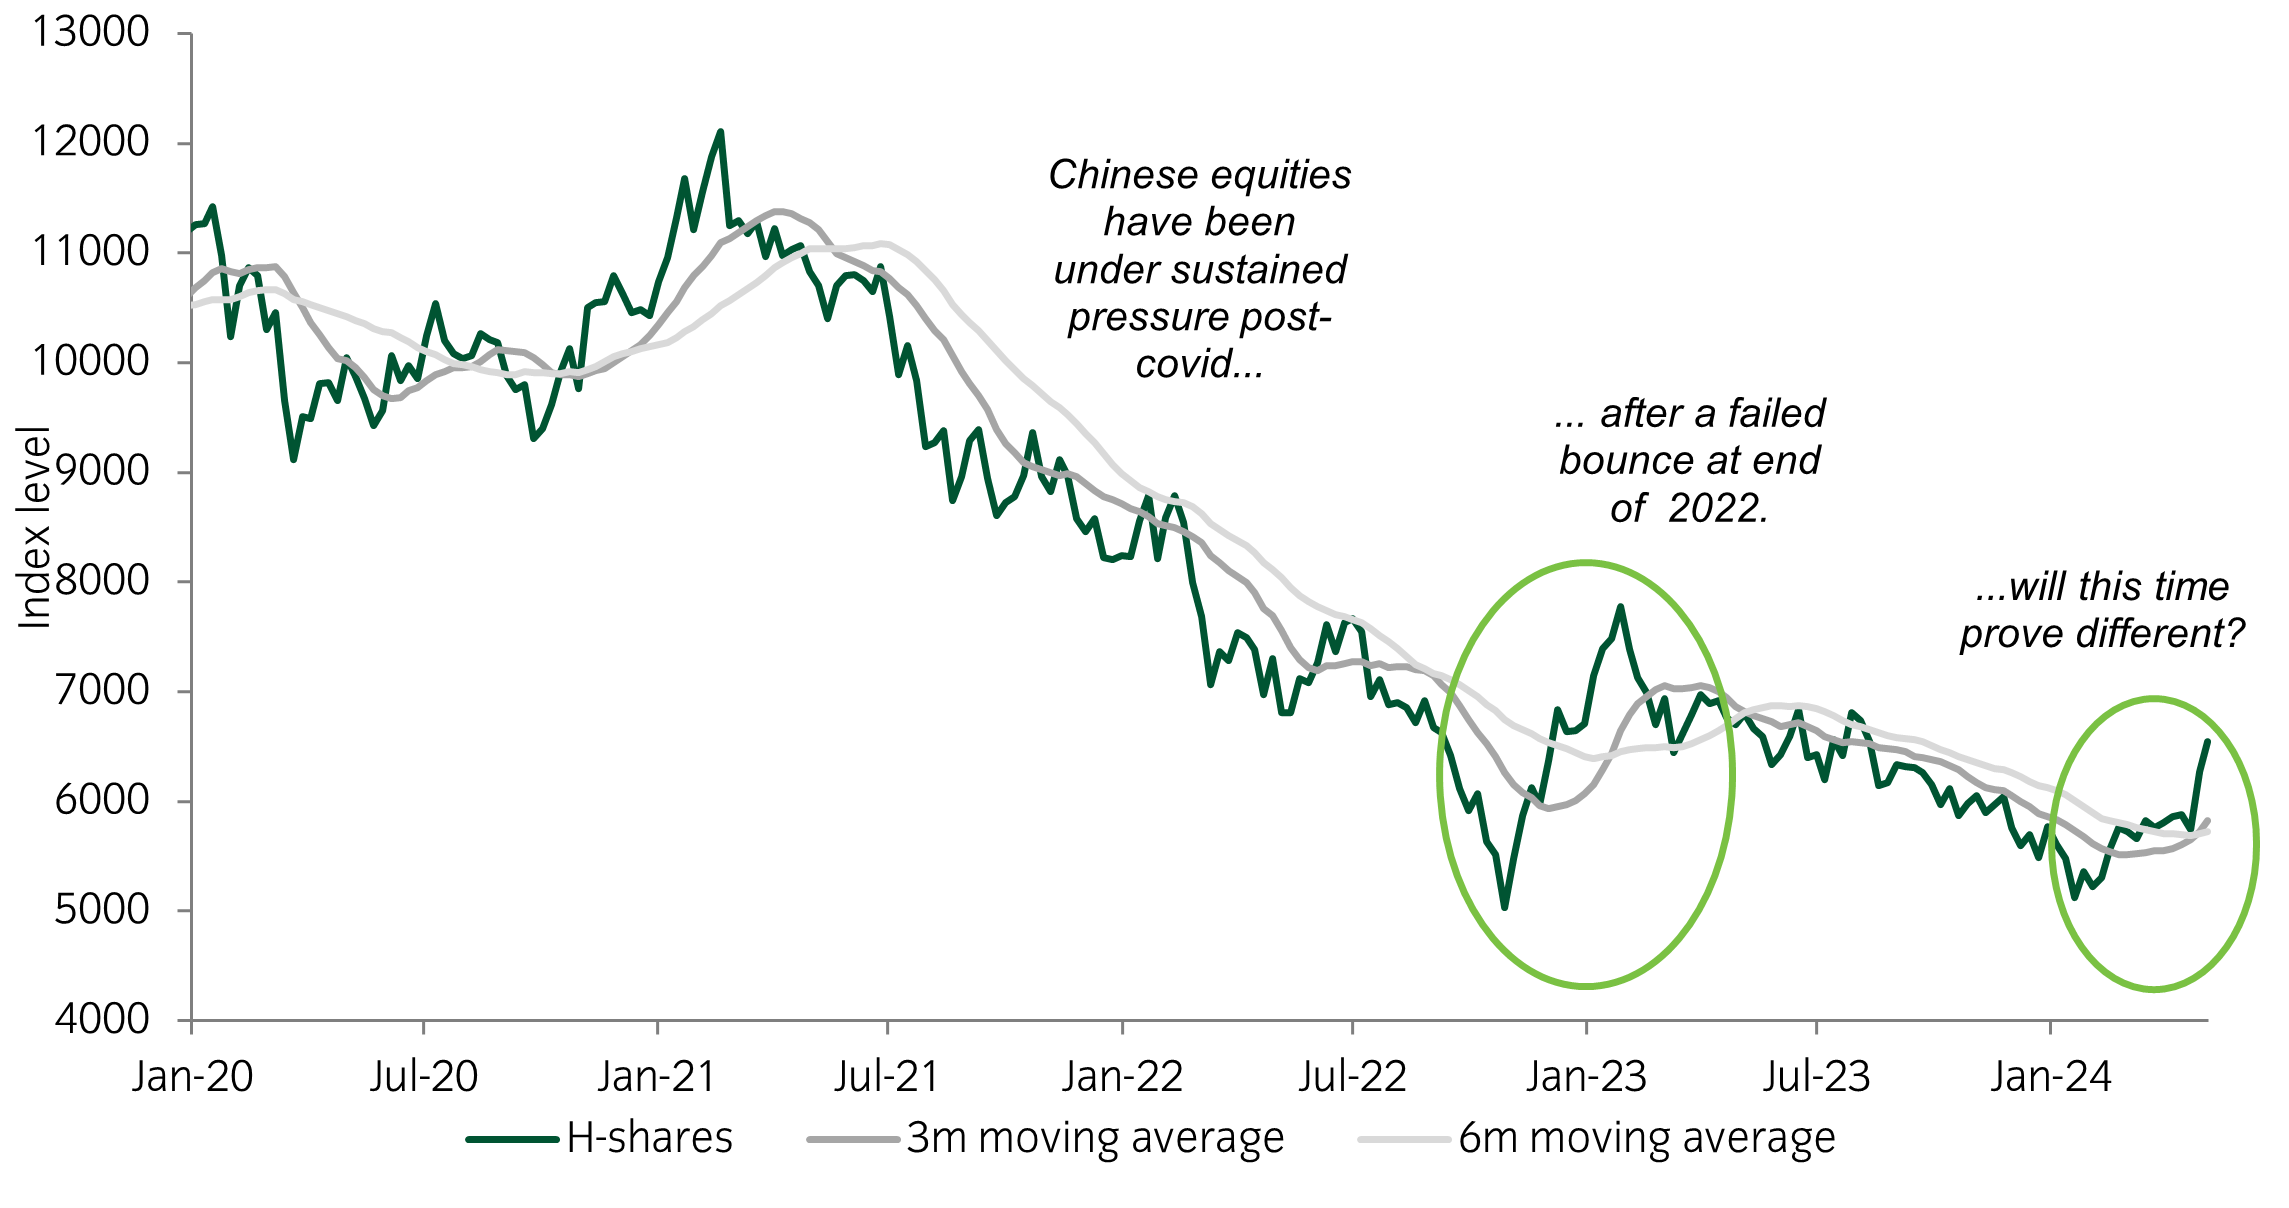
Source: Insight and Bloomberg as at 10 May 2024.
- It has been a tough few years for investors in Chinese equities, as a disappointing Covid reopening and stressed property sector have combined to push indices more than 50% off their highs.
- Following a mini capitulation at the beginning of 2024, the Insight Broad Opportunity Strategy added a short dated option trade that will perform well if this momentum is continued over the next couple months. While the H-shares index has broken out from its downtrend, it remains to be seen whether this strong momentum will be sustained over the medium term.
Chart of the week
Figure 1: Higher velocity moves in government bond yields hurt equities in April
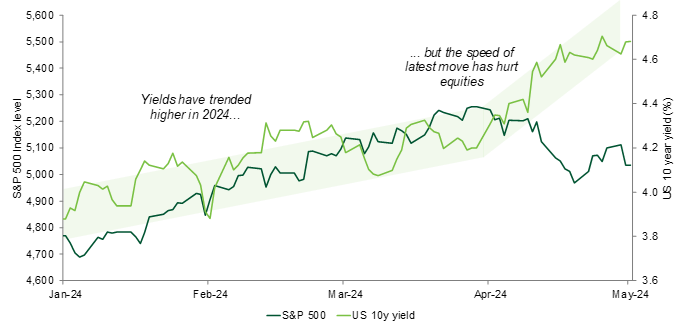
Source: Insight and Bloomberg as at 1 May 2024.
- This week’s chart highlights the interaction between government bond yields and equities in 2024, particularly how the latest leg higher in yields has stalled the equity rally.
- For most of the first quarter, yields trended higher as the combination of strong growth data and upside inflation led investors to push back the timing of expected rate cuts. Against this backdrop, equities enjoyed their third strongest start to the year since 2000. However, as upside inflation surprises have continued, the rate of change of yields has increased and in turn created a tough environment for risk assets.
Market watch
Figure 2:
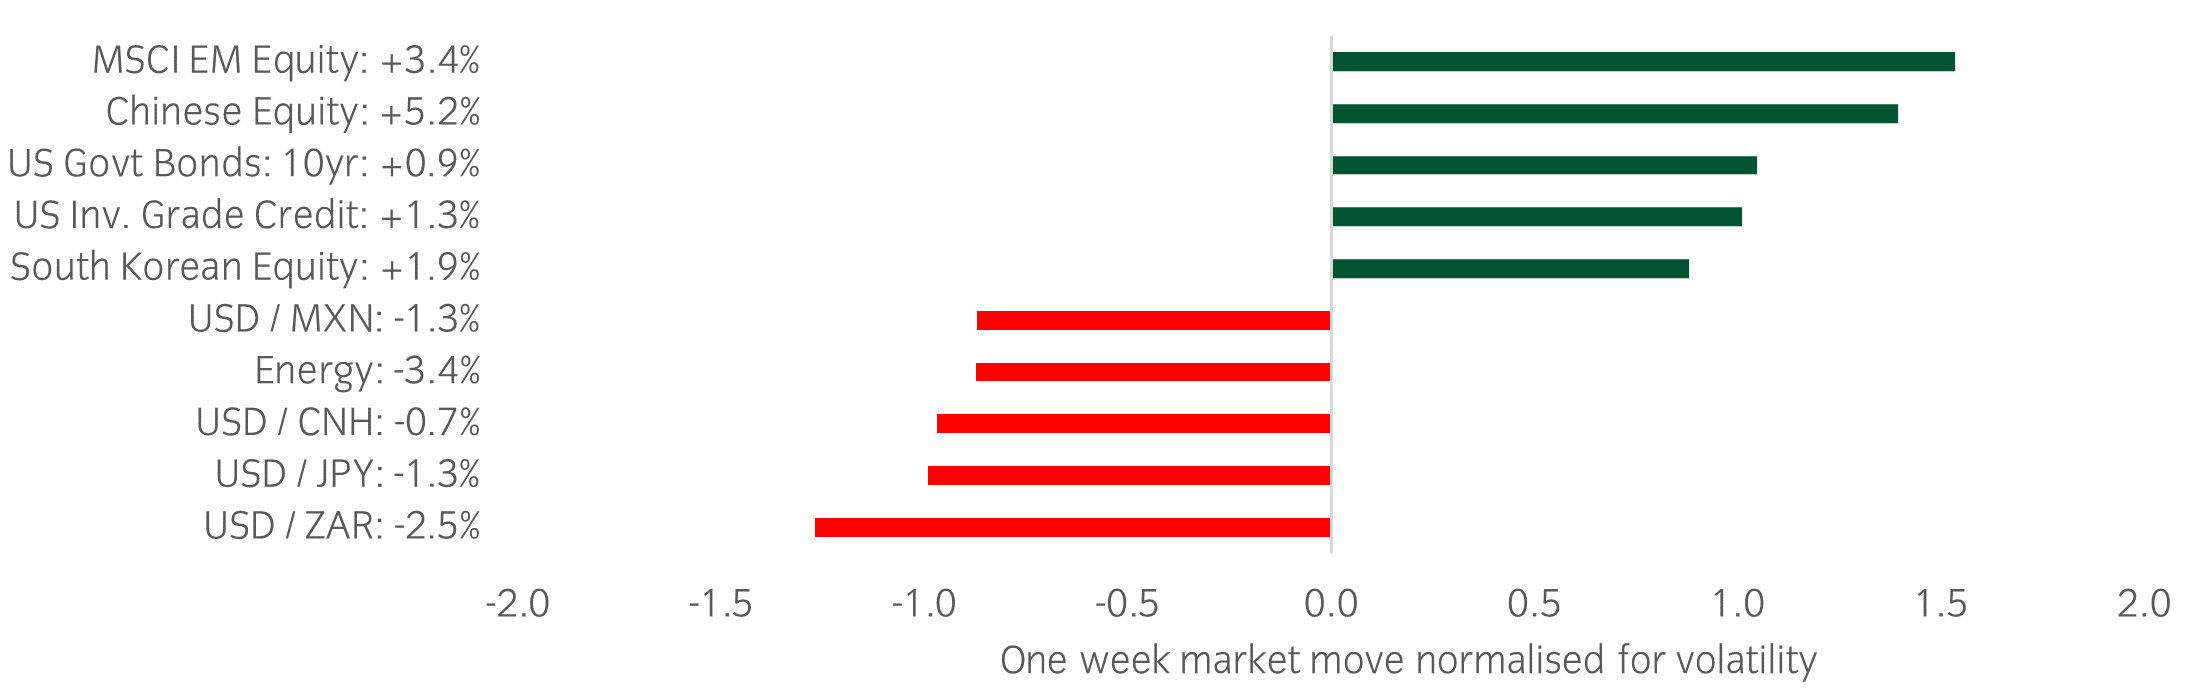
Source: Bloomberg and Insight as at 3 May 2024.The price movement of each asset is shown next to its name. The data used by the bar chart divides the price movement by the annualised historical volatility of each asset.
In a busy week, the following events caught our eye:
- It was another busy week for in the global earnings season. Q1 results have been particularly strong in the US, with 78% of S&P 500 companies beating estimates. Tech and communication services continue to be the biggest drivers. Despite the strong results, the share price reaction has been mixed as some companies have issued more cautious outlooks than investors expected. That said the results of Amazon and Apple were well received by the market and helped boost sentiment.
- There was a lot of economic data released this week. The release that most moved the market was the US Employment Cost Index, which came in much stronger than forecast. This led to an increase in government bond yields and a fall in equity markets as the data added to fears that inflation will take longer to fall to target than hoped. On the following day, however, the ISM manufacturing survey was weaker than expected with the New Orders component particularly weak.
- The US Federal Reserve met on Wednesday. As expected, no major changes to policy were made. In the press conference, Fed Chair pushed back against the idea that the next change in rates could be higher.
Winners & losers: Another volatile week for markets. Within equities, Chinese stocks were particularly strong as the technology sector outperformed. The Japanese Yen reversed recent weakness as authorities there finally intervened in the FX market after weeks of threatening action.
Asset allocation observation
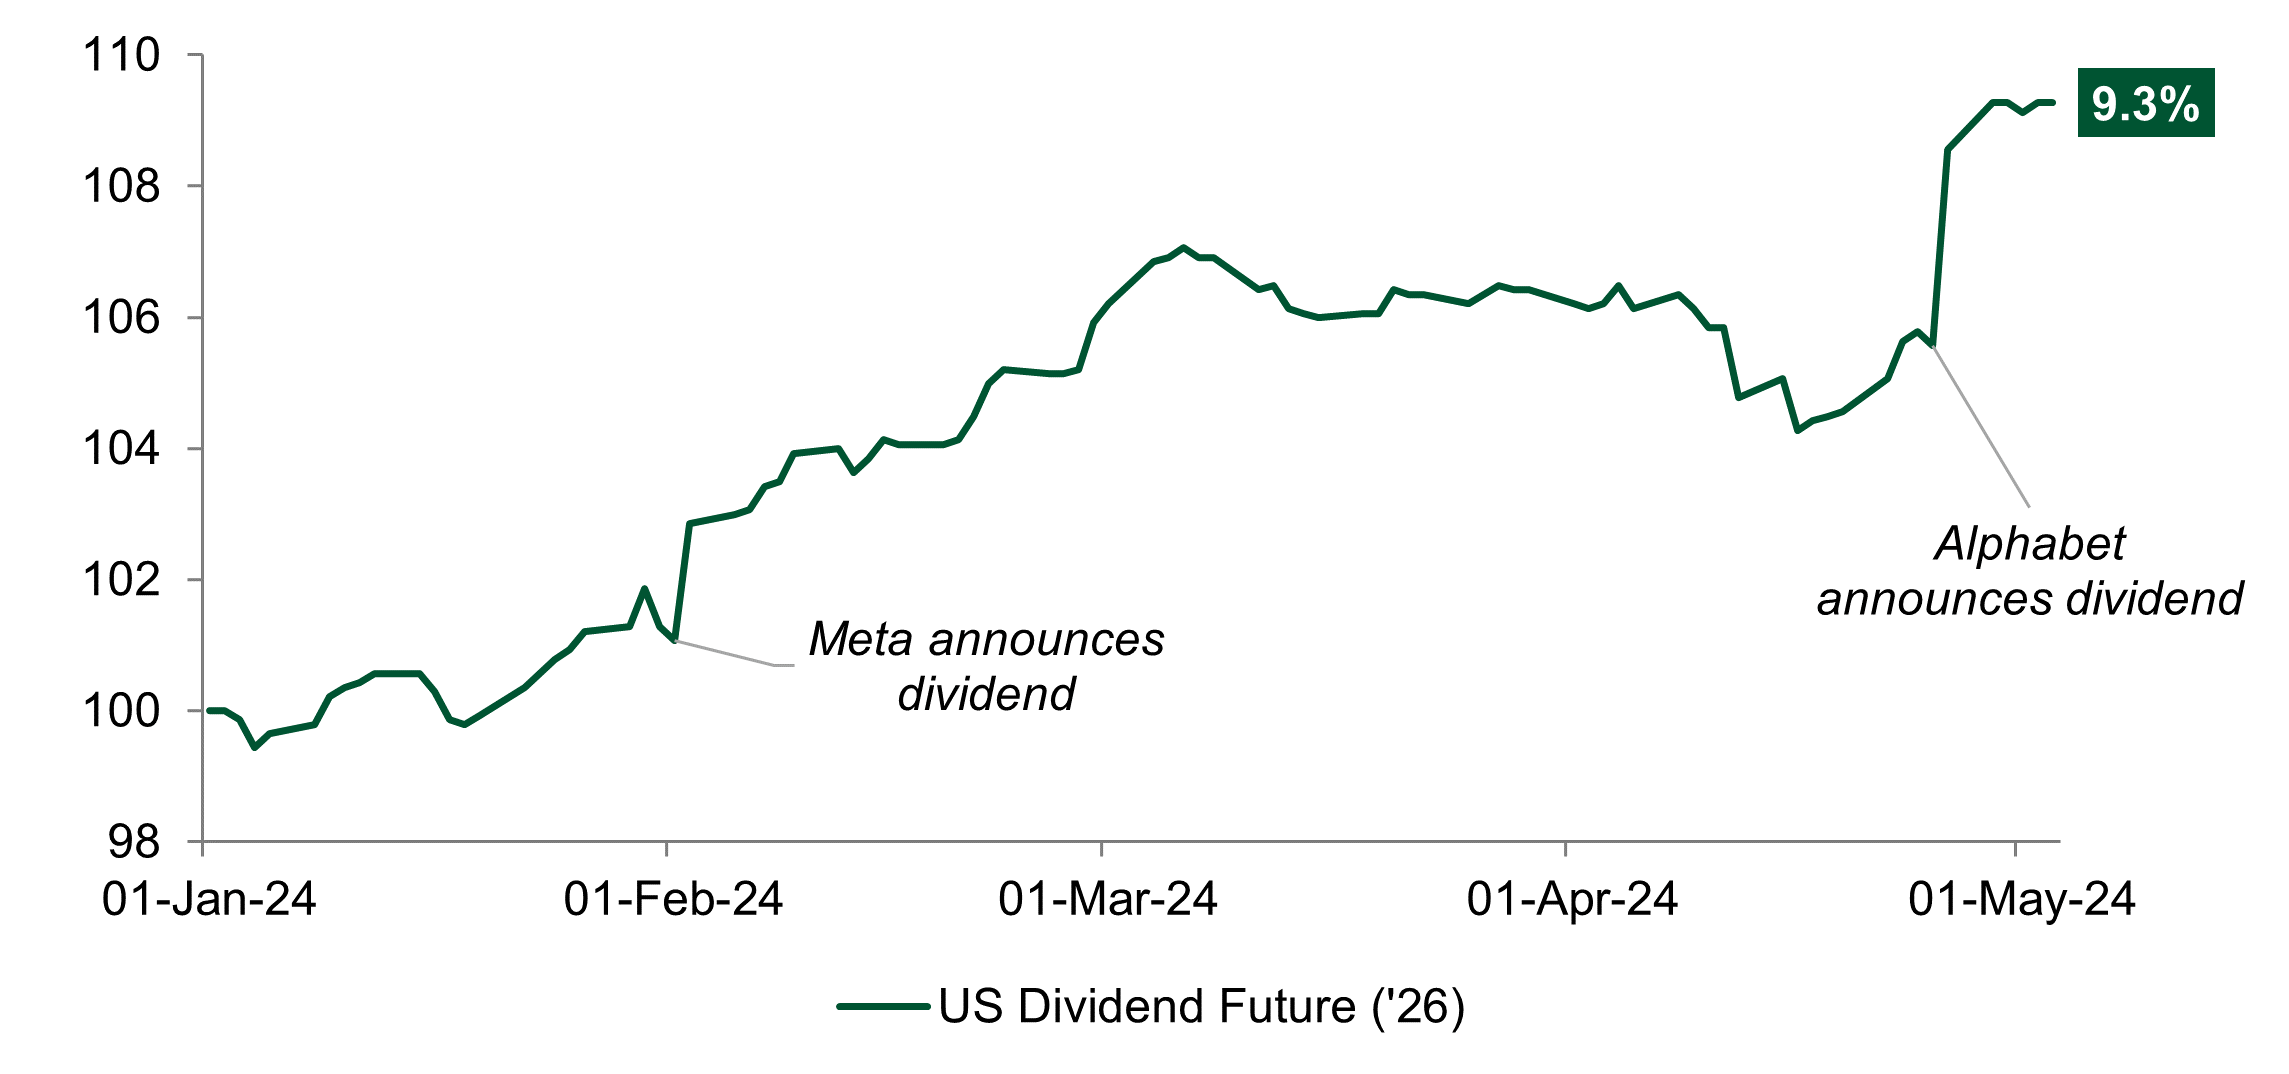
Figure 3: Megacap participation improves dividend outlook
Source: Bloomberg and Insight as at 2 May 2024.
- Entering 2024, only three of the Magnificent 7 (Microsoft, Apple, Nvidia) were dividend paying companies. However, Meta back in February and Alphabet this week announced they would start paying a dividend. This signalled to investors that in this higher yielding world, dividends have a role alongside share buy backs in returning profits back to shareholders.
- Our dividend future exposure has benefitted from this mindset shift. For example, the 2026 US dividend future is up 9.3% this year, outperforming its underlying index (S&P 500 +6.6%).