 United States


We believe that high yield investors can benefit from including a dedicated fallen angels strategy as a permanent "overweight" within their allocation.
Within the high yield market Fallen Angels have:
- Delivered highest returns, despite the highest credit quality in high yield
- Outperformed other high yield categories during rising rate periods
- Outperformed other high yield market when credit downgrades have risen
On average, Fallen Angels have higher credit ratings than the broader high yield market
Currently, 85% of the Fallen Angels index has a Ba rating (the highest in the high yield market), making it the highest quality high yield category in terms of credit rating when compared to the broad market and the liquid segment (Table 1).
Table 1: Fallen Angels tend to have higher credit quality than broad high yield
| As of October 2021 | Broad | Liquid | Fallen Angels |
|---|---|---|---|
| Ba exposure | 49% | 38% | 85% |
| B exposure | 40% | 51% | 12% |
| Caa and lower | 11% | 11% | 3% |
Source: Bloomberg, February 2023
Despite this, Fallen Angels have delivered relatively high returns since 2004, when granular data become available. The broader market has performed in a lower-octane fashion, while the liquid market has performed less well on a risk-adjusted basis (Figure 1).
Figure 1: Fallen angels has delivered “higher octane” performance (higher returns and higher volatility) than the broader high yield market
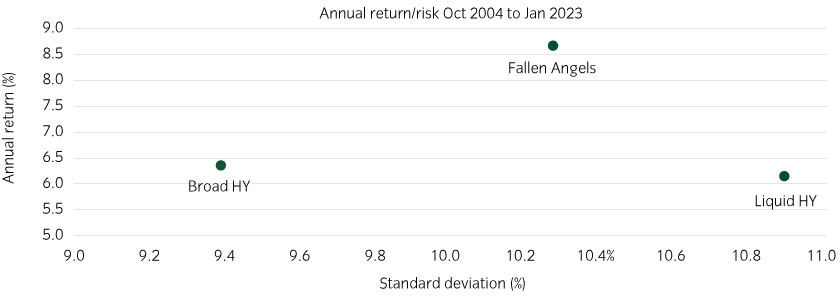
Source: Bloomberg, Insight calculations, October 2004 to January 2023. Bloomberg US High Yield Corporate 1-5 Year Index, Bloomberg US Corporate High Yield Index, Bloomberg US High Yield Very Liquid Index, Bloomberg US High Yield Fallen Angel 3% Cap Index. Please see index descriptions at the back of the document. Past performance is not indicative of future results. Investment in any strategy involves a risk of loss which may partly be due to exchange rate fluctuations.
On a rolling 3-year basis to the end of January 2023, Fallen Angels have outperformed the other categories 97% of the time. On a rolling 5-year basis, Fallen Angels has outperformed broad high yield 92% of the time and liquid high yield 100% of the time1. Albeit, returns for Fallen Angels have historically been more volatile than the broader high yield market on a shorter-term basis.
Fallen Angels saw the lowest maximum drawdown of the three during the period (Figure 2).
Figure 2: Fallen Angels, despite high volatility, has seen the lowest maximum drawdown3

Source: Bloomberg, Insight calculations, February 2023. Using monthly return data.
Fallen Angels have even outperformed the broad and liquid high yield indices when rates have risen, despite their greater rate risk
Fallen angels tend to be longer dated than other high yield bonds, and thus have higher interest rate risk. Despite this, they have largely outperformed the other categories during the seven periods since 2004 that rates have risen (Figure 3).
Figure 3: Fallen Angels have generally outperformed other high yield bonds when rates have risen
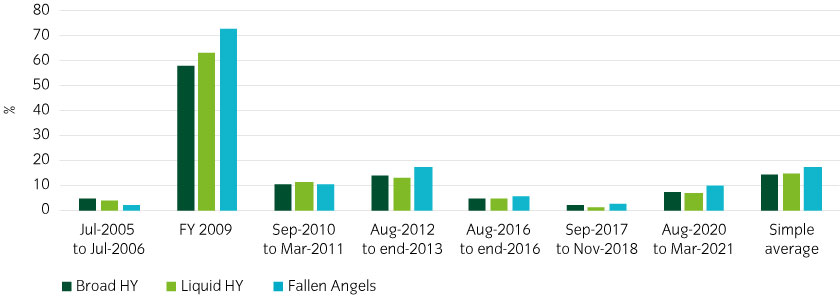
Source: Bloomberg, February 2023. Past performance is not indicative of future results. Investment in any strategy involves a risk of loss which may partly be due to exchange rate fluctuations.
This is partly because rates tend to rise when the economy is improving, and thus when credit spreads are narrowing.
So, while Fallen Angels have historically seen negative contribution from interest rate risk when yields have risen, they have seen a greater positive return contribution from credit spreads, more so than the other areas (Table 2).
Table 2: Fallen Angels have generally seen the highest total returns through rising rates
| Broad HY Corp | Liquid HY Corp | Fallen Angels Corp | |||||||
|---|---|---|---|---|---|---|---|---|---|
| Total return | Spread return | Rate Return | Total return | Spread return | Rate Return | Total return | Spread return | Rate Return | |
| Jun 2005 - June 2006 | 4.80% | 5.95% | -1.14% | 3.92% | 5.48% | -1.56% | 2.25% | 4.27% | -2.02% |
| Dec 2008 - Dec 2009 | 58.21% | 59.85% | -1.64% | 63.49% | 65.62% | -2.13% | 73.08% | 75.52% | -2.44% |
| Aug 2010 - Mar 2011 | 10.46% | 12.35% | -1.90% | 11.50% | 13.83% | -2.33% | 10.25% | 13.42% | -3.18% |
| Jul 2012 - Dec 2013 | 13.84% | 15.98% | -2.14% | 13.20% | 15.65% | -2.45% | 17.45% | 21.61% | -4.15% |
| Jul 2016 - Dec 2016 | 4.57% | 7.35% | -2.77% | 4.58% | 7.77% | -3.20% | 5.48% | 10.18% | -4.70% |
| Aug 2017 - Oct 2018 | 2.31% | 3.80% | -1.49% | 1.10% | 2.98% | -1.87% | 2.40% | 5.48% | -3.07% |
| Aug 2020 - Oct 2022 |
-2.06% |
9.67% | -11.73% | -3.45% | 8.49% | -11.94% | -1.82% | 15.93% | -17.75% |
| Simple Average | 13.16% | 16.42% | -3.26% | 13.48% | 17.12% | -3.64% | 15.59% | 20.92% | -5.33% |
Source: Bloomberg, Insight calculations, February 2023. Past performance is not indicative of future results. Investment in any strategy involves a risk of loss which may partly be due to exchange rate fluctuations
Fallen Angels also offer potential for capital gains during economic upswings
Inefficient market dynamics have helped managers target excess returns in Fallen Angels. Fallen Angels suffer "forced selling" from passive investment grade accounts when downgraded to high yield, frequently causing disproportionate spread widening during the month of the downgrade, which often reverts once trading activity normalizes. Similar "forced buying" occurs for rising stars, aggressively tightening spreads. As such, despite lower credit spreads, Fallen Angels’ total returns have historically seen the highest credit spread performance (Figure 5).
Figure 5: Fallen Angels have historically seen greater contribution from credit spreads since October 2004
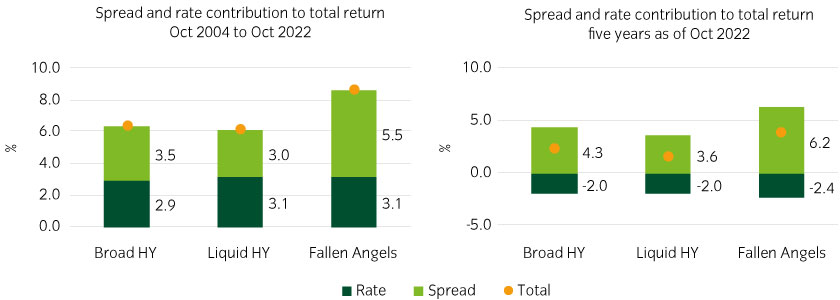
Source: Bloomberg, Insight calculations, February 2023. Past performance is not indicative of future results. Investment in any strategy involves a risk of loss which may partly be due to exchange rate fluctuations.
Fallen angels have outperformed broad high yield when downgrades are high
Historically, the Fallen Angels index has outperformed the broad market during periods of high downgrade activity. This potentially provides a free ‘call option’ versus the broad market for when market conditions become challenging (Figure 6).
Figure 6: Fallen Angels have delivered solid performance through difficult markets
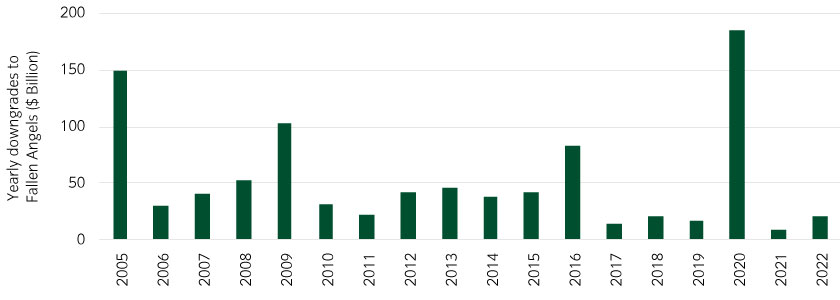
Source: Bloomberg, Insight calculations, February 2023
We believe a dedicated fallen angels strategy should be a cornerstone of a high yield allocation
We believe that high yield credit offers value as a strategic allocation given the rise in yields over the last year.
We also believe that a dedicated Fallen Angels allocation can enhance a high yield investment strategy, especially for investors able to access innovative liquid sources in fixed income.
Fallen Angels have delivered, in our view, compelling historical risk-adjusted returns and offer potential upside through difficult market conditions, spells of strong economic growth and periods of rising rates.
We believe investors may find Fallen Angels valuable as a core allocation within high yield, a higher-octane high yield strategy (but with defensive characteristics) that complements a private debt allocation or a compelling allocation within a multi-manager framework.