 United States


April 12, 2022
Fixed income
CPI reached another 40-year high at 8.5%, slightly above consensus, with energy CPI up 11% month-on-month (relating to the war in Ukraine). Core CPI, which ignores food and energy prices, fared slightly better at 6.5%, just below consensus (albeit still another 40-year high), largely thanks to a retracement in used car prices.
There are signs that price pressures in “flexible” categories are beginning to fade, meaning “sticky” services as well as commodities may drive inflation for the rest of the year, leading to a moderating but above-target trajectory. Importantly, we believe markets are slightly overpricing the Fed’s hiking activity into year-end, meaning it could be time for investors to consider compelling entry points in certain areas of fixed income.
The drivers of CPI are shifting from the “flexible” to the “sticky” categories
As we continue to stress, in our view it is important to split the CPI index across three dimensions:
- “Sticky” services categories (e.g. healthcare and rents)
- “Flexible” categories (such as those impacted by supply chain disruptions)
- Commodity categories (like food and energy-related areas)
Through this lens, the drivers of CPI look to be shifting from flexible goods to sticky services and commodities. This is best illustrated by used car prices (one of 2021’s highest “performing” assets) falling 3.8% in March (scroll down to Table 1 at the end for a breakdown of how each category performed).
This supports our view that decelerating flexible categories will allow inflation to moderate by the end of the year, but sticky categories will keep CPI meaningfully above target—perhaps around the ~4% region.
Regarding commodities, the surge in energy prices receives much attention, but notably food prices are rising at their fastest pace in forty years at 8.5% year-on-year (Figure 1). While the oil futures curve currently suggests the former may moderate, we expect the latter to remain elevated for some time.
Figure 1: Food inflation is running at a 40-year high1
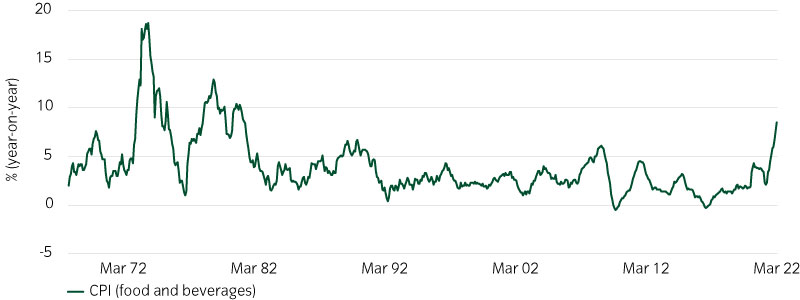
The rise in food prices is partly explained by the fact (as with oil prices) that both Russia and Ukraine were collectively responsible for around a third of the world’s wheat exports before the invasion.
This has resulted in significant disruption, compounded by the fact that it is relatively difficult for countries with strategic grain reserves (such as China) to release their inventory into global markets quickly, unlike petroleum markets (where other oil producing nations have helped fill in the gaps).
In the US, we therefore believe higher food prices are a risk to the consumer, as people may need to divert funds previously available for discretionary spending. However, this may not be a headwind to GDP, as we expect savings (amassed since the start of the pandemic) to fall before spending does.
Wages and rents remain the most important long-term drivers of inflation in our view
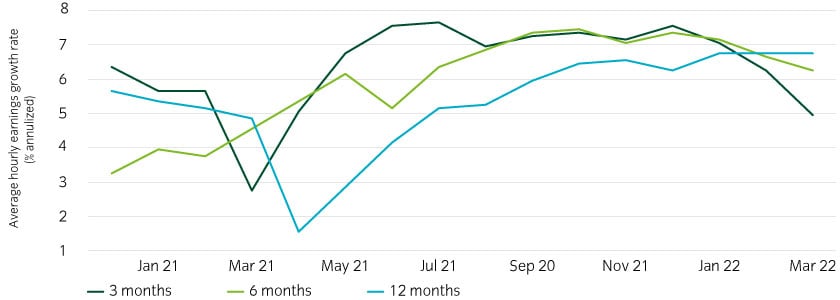
Wages are the primary driver of sticky services costs. Notably, they have been decelerating lately on a month-on-month basis (though not yet on a year-on-year basis) as many workers have re-entered the labor force after having left during the height of the pandemic (Figure 2).
Figure 2: Rising labor participation could be starting to help cool wage growth2
Wages naturally feed into rents, which as we have mentioned in many Instant Insights, is our top metric to watch for clues about the persistence of inflation. Owner’s equivalent rent continued to tick up at a 0.4% monthly pace (Table 1) and is now up 4.5% year-on-year.
For those interested, we would highly recommend our just-published Global Macro Research paper “Modelling the Persistence of US inflation”, which explains, in simple terms, our predictive model for US rental inflation. Our analysis suggests that rents are likely to moderate in the second half of this year but to remain above pre-COVID levels at least through 2023.
Key to shelter (or rental) inflation, is whether the recent strength in the housing market will cool. On one hand, rising mortgage rates (in line with the Fed’s hawkish pivot) should help, but supply shortages remain a concern (Figure 3).
Figure 3: Housing completions over 10-years indicate large secular drop off in housing supply3
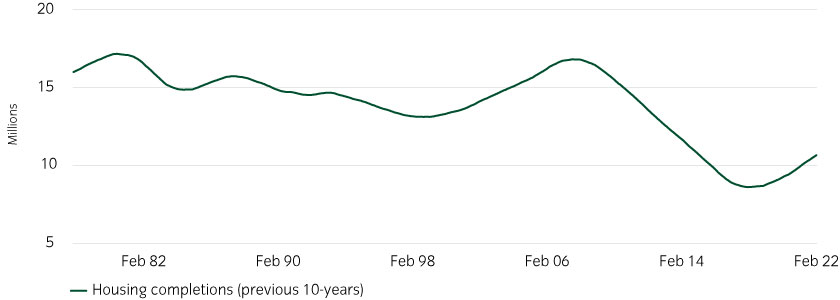
Consider that in the 2000s, the US built 15.6 million homes, but just 9.1 million in the 2010s. Of course, the 2000s saw far too much building, feeding the housing bubble that would burst in 2008. But we believe the large subsequent drop overcompensated. As such, while shelter costs will potentially ease, we see them remaining relatively elevated.
The Fed will be under pressure to deliver 50bp hikes
Although today’s inflation release was not a surprise, it underlines the inflation pressure that consumers and businesses are feeling in the real economy.
In our view, this will help confirm a 50bp rate hike at the Fed’s next meeting in May, with a further 50bp hike in June also in-the-cards. If inflation does decelerate into the summer, in line with our current views, the Fed may then revert to 25bp hikes.
We currently believe the market is slightly overpricing the rate hikes for the rest of the year, but nonetheless we see 2.25% of hikes as a reasonable base case for 2022.
As such, we believe most of the pain from higher rates may already be reflected in current market pricing and investors should increasingly consider entry points for selective areas of credit (such as carefully selected low duration high yield credit) that make up our key investment picks for the rest of the year.
You can watch Alex Veroude, our CIO, Fixed Income, provide a 2-minute overview of these picks in our new video linked below.
Table 1: Apart from energy, “flexible” inflation components are showing signs of moderating4
| Sticky categories | Flexible categories | Non-core categories | |||||||
|---|---|---|---|---|---|---|---|---|---|
| Health services | Owners equivalent rent | Rents | Education and Communication |
Airfare | Used cars | Apparel | Food | Energy | |
| Dec-20 | -0.1% | 0.2% | 0.1% | 0.1% | -2.7% | -1.1% | 0.5% | 0.3% | 3.7% |
| Jan-21 | 0.5% | 0.1% | 0.1% | 0.1% | -1.8% | -0.9% | 1.4% | 0.2% | 2.8% |
| Feb-21 | 0.4% | 0.2% | 0.2% | 0.1% | -2.1% | -0.7% | -0.5% | 0.1% | 4.6% |
| Mar-21 | 0.1% | 0.2% | 0.3% | 0.0% | 0.9% | 0.3% | 0.4% | 0.2% | 5.6% |
| Apr-21 | 0.0% | 0.2% | 0.4% | 0.2% | 10.0% | 9.8% | 0.6% | 0.4% | -1.2% |
| May-21 | -0.1% | 0.3% | 0.3% | 0.2% | 8.8% | 7.7% | 1.1% | 0.5% | 0.7% |
| Jun-21 | 0.0% | 0.3% | 0.5% | 0.1% | 0.9% | 10.1% | 0.5% | 0.7% | 2.1% |
| Jul-21 | 0.2% | 0.3% | 0.4% | 0.1% | -3.3% | 0.0% | 0.1% | 0.7% | 1.6% |
| Aug-21 | 0.2% | 0.3% | 0.2% | 0.2% | -8.6% | -1.2% | 0.3% | 0.4% | 1.9% |
| Sep-21 | 0.2% | 0.4% | 0.4% | 0.3% | -5.9% | -0.5% | -0.7% | 0.9% | 1.2% |
| Oct-21 | 0.4% | 0.4% | 0.4% | 0.2% | -1.1% | 2.5% | 0.6% | 0.9% | 3.7% |
| Nov-21 | 0.3% | 0.4% | 0.5% | 0.1% | 1.9% | 2.4% | 0.7% | 0.8% | 2.4% |
| Dec-21 | 0.3% | 0.4% | 0.4% | 0.1% | 2.5% | 3.3% | 1.1% | 0.5% | 0.9% |
| Jan-22 | 0.6% | 0.4% | 0.4% | 0.1% | 2.3% | 1.5% | 1.1% | 0.9% | 0.9% |
| Feb-22 | 0.1% | 0.4% | 0.6% | 0.1% | 5.2% | -0.2% | 0.7% | 1.0% | 3.5% |
| Mar-22 | 0.6% | 0.4% | 0.4% | -0.1% | 10.7% | -3.8% | 0.6% | 1.0% |
11.0% |