Chart of the week
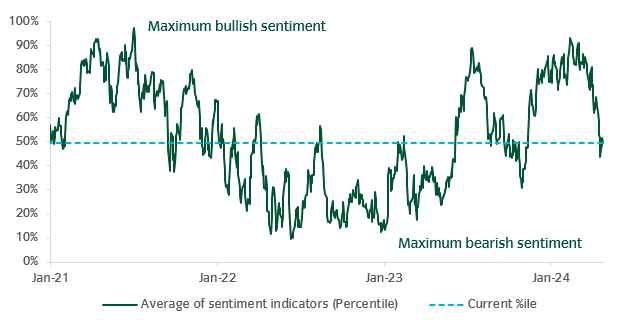
Figure 1: Reduced investor risk sentiment & positioning from earlier in 2024
Source: Insight and Bloomberg as at 26 April 2024.
- Aggregate investor positioning and risk sentiment has reduced since the beginning of 2024. This has coincided with recent geopolitical tensions in the Middle East, a reappraisal of the inflation outlook and monetary policy implications, and rising bond yields. We see the potential for risk appetite to return if some of these risks were to abate in the near term.
Market watch
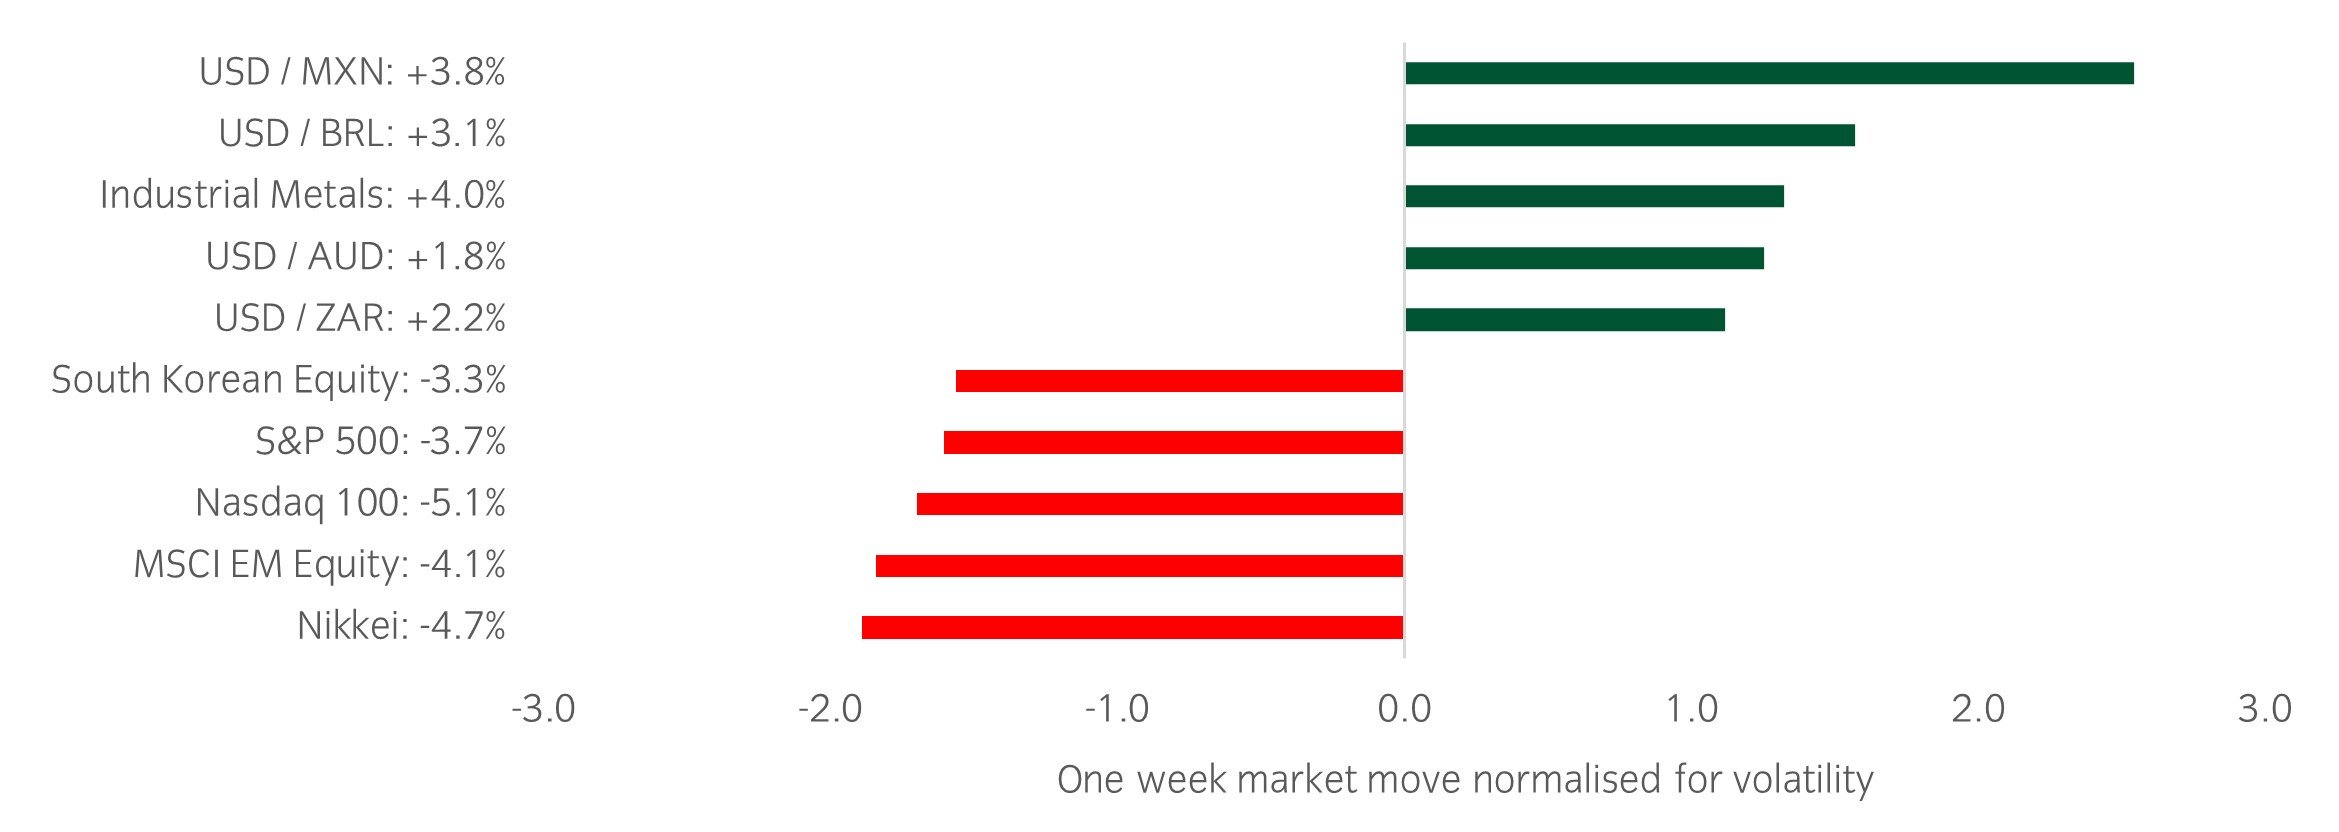
Figure 2:
Source: Bloomberg and Insight as at 26 April 2024.The price movement of each asset is shown next to its name. The data used by the bar chart divides the price movement by the annualised historical volatility of each asset.
In a busy week, here are two things that caught our eye:
- In what was a bumper week for earnings, the mixed picture from Big Tech created a choppy environment for US equity markets. Meta sank 10% on higher expected capital expenditure in 2024, whilst Alphabet (+11.6% after hours) and Microsoft (+4.3% after hours) beat estimates, with cloud computing demand and AI-related offerings fuelling broader market strength.
- The Bank of Japan kept its short-term rates steady and refrained from any major hawkish surprises at their Friday meeting, which pushed the yen to 156 per dollar, its weakest level since 1990. Notably, Japanese Finance Minister Shunichi Suzuki indicated that the current USD/JPY level is a reflection of the fundamentals, a somewhat opposing view to other recent senior official commentary.
Asset allocation observation
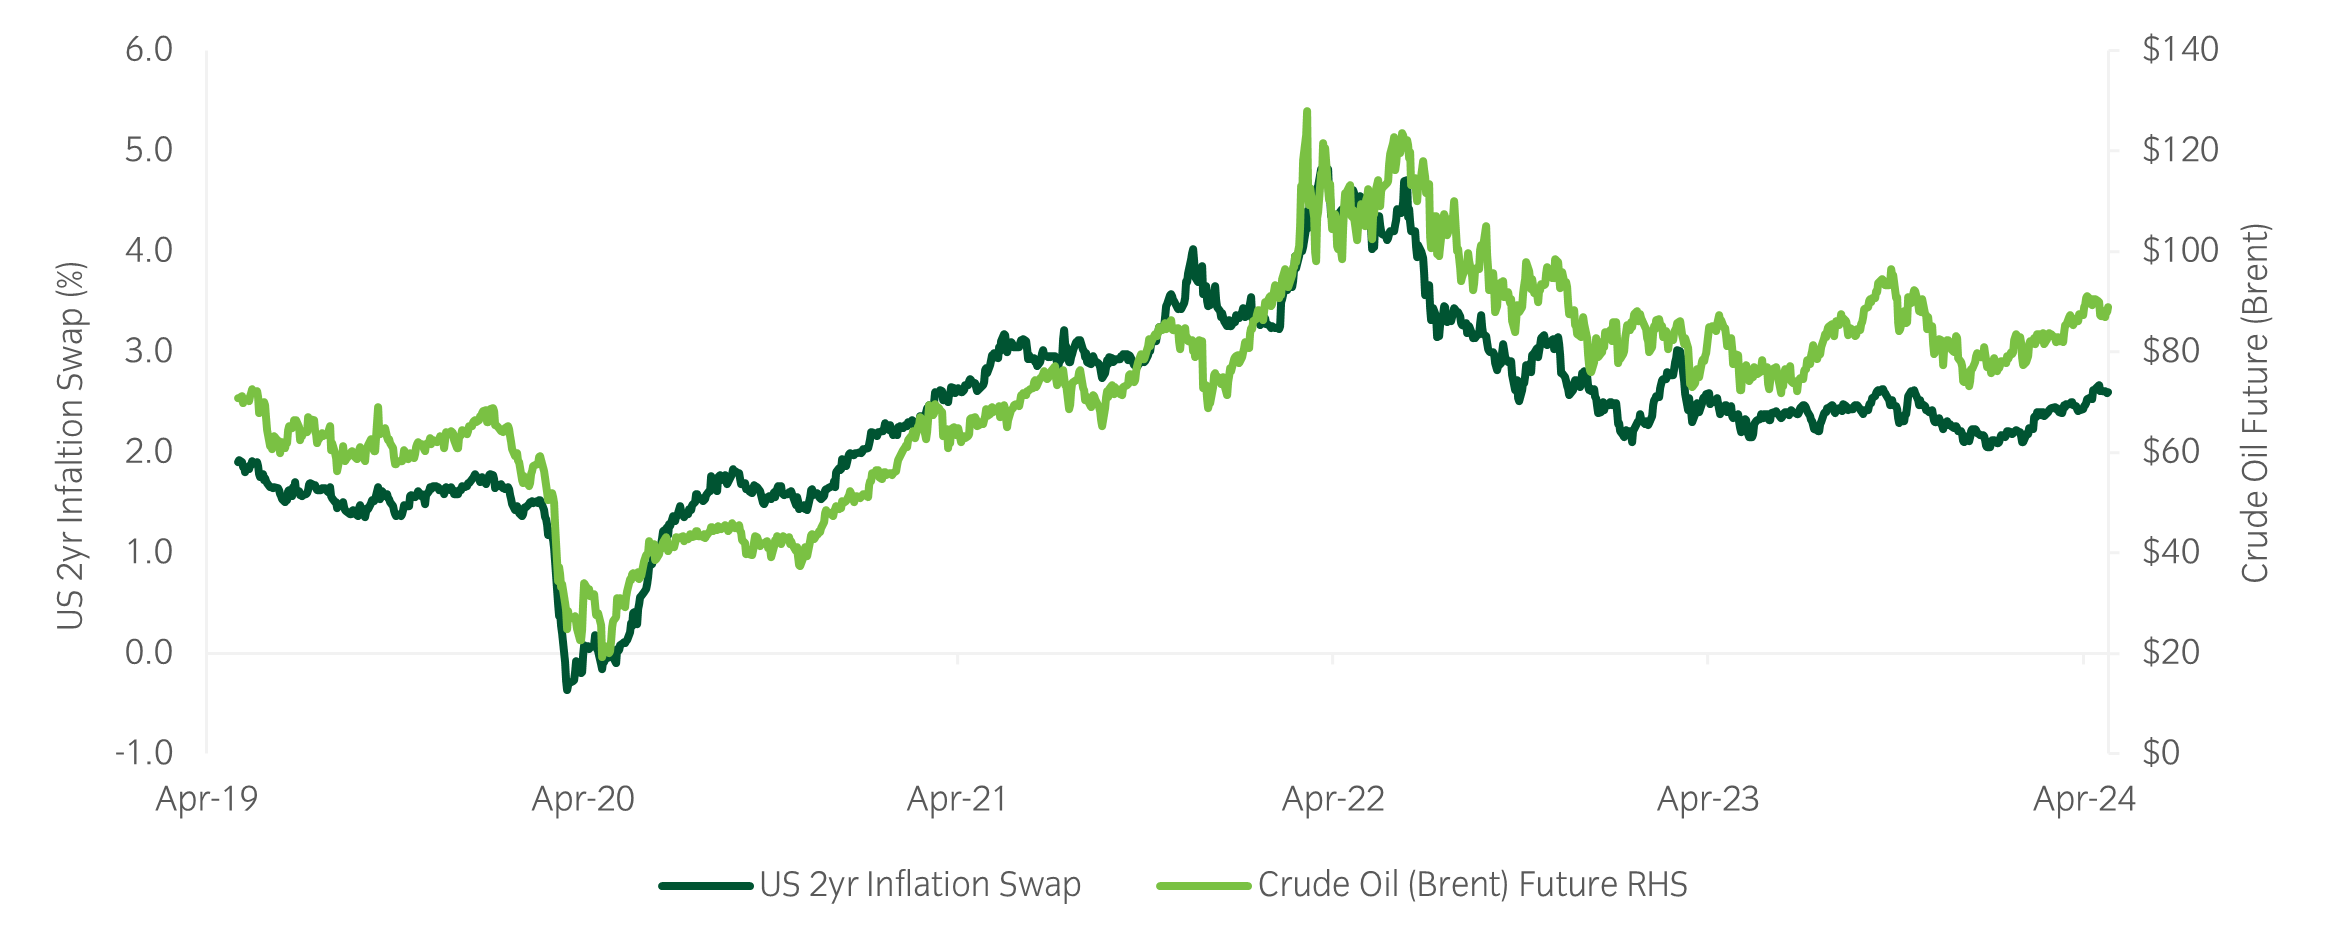
Figure 3: Inflation uncertainty
Source: Bloomberg and Insight as at 26 April 2024.
- The rise in oil prices this month coincided with an increase in market-implied expected inflation, referenced by the 2-year US inflation swap. Uncertainty around inflation outcomes remains elevated with potential implications for prospective monetary policy, which in turn could affect bond yields and outlook for risk assets.
- Against this backdrop, we continue to maintain low duration in the strategy’s fixed income exposures. To improve diversification, we favour long US dollar exposures, which could help mitigate portfolio impact in periods of market stress.
Chart of the week
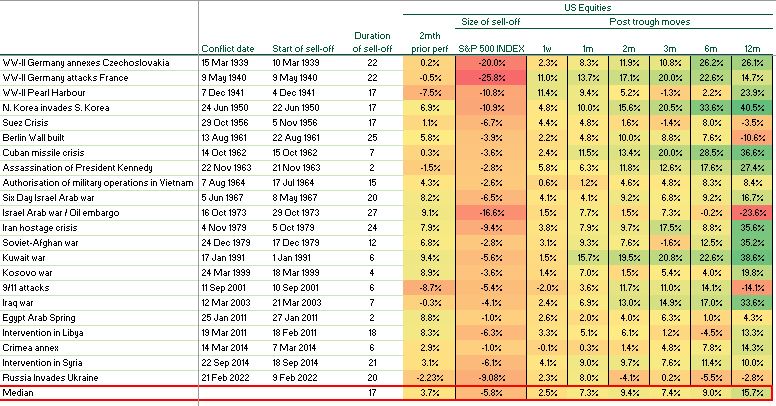
Figure 1: Conflicts, stock market setbacks and recoveries
Source: Insight and Bloomberg as at 17 April 2024.
- Equity markets fell this week as escalating tensions in the Middle East and higher bond yields weighed on risk sentiment. The risks of further escalation have increased too and the scale of the sell-off so far is currently not out of the norm for geopolitical shocks.
- The table above shows historic S&P 500 falls during significant geopolitical events. The largest drawdowns historically were those when a clear macroeconomic impact followed - be it growth or inflation. In the context of a crisis in the Middle East, energy prices will remain a key focal point for financial markets.
Market watch
Figure 2:
Source: Bloomberg and Insight as at 19 April 2024.The price movement of each asset is shown next to its name. The data used by the bar chart divides the price movement by the annualised historical volatility of each asset.
In a busy week, here are two things that caught our eye:
- Geopolitical escalation in the Middle East has sent VIX to 6-month highs and equities lower.
- There has been a clear shift in the narrative of the Federal Reserve’s Open Market Committee this week, with a slew of central bank speakers tempering rate cut expectations. Most notably, Fed Vice Chair Jefferson stated: “If incoming data suggest that inflation is more persistent than I currently expect it to be, it will be appropriate to hold in place the current restrictive stance of policy for longer”, New York Fed President Williams and Atlanta Fed President Bostic followed up with similar comments.
Winners & losers: There were several crosswinds this week, but there was a risk off market tone with equities down and the US dollar up. That said government bonds were flat. Within equities, the Nikkei and Nasdaq were the relative underperformers as an unwind in momentum has hit the year-to-date winners hardest. The dollar outperformed, particularly against more cyclically sensitive currencies such as the Mexican Peso and Brazilian Real. Rates were initially pushed higher off the back of a strong US retail print early in the week and hawkish Fed narrative, although look likely to end the week unchanged as geopolitical risks pulled them lower.
Chart of the week
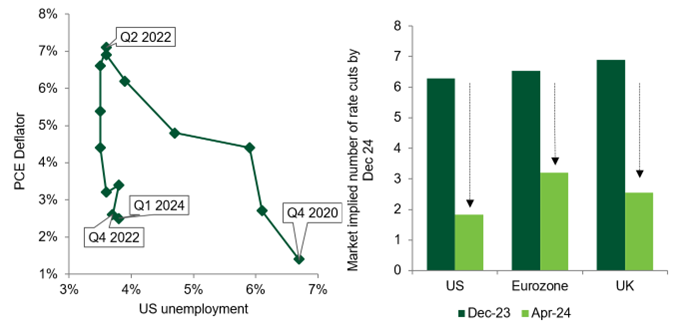
Figure 1: Does the next leg lower in US inflation need the economy to weaken?
Source: Insight and Bloomberg. Data as at 12 April 2024.
- The big picture is that the impressive fall in US inflation since the middle of 2022 has not required any weakening in the US labour market.
- The strength of the US labour market was confirmed by last week’s strong jobs report which beat expectations for the fourth month in a row.
- Various measures of inflation, however, have been stickier this year and have generally stopped falling. On Wednesday, this trend continued as the new US CPI report showed that inflation had once again beaten expectations.
- The strength of the economy and the stickiness of inflation have caused the number of rate cuts priced in this year to be dramatically reduced.
- These trends also raise the question of whether the next leg lower in inflation will require growth and the labour market to weaken.
Market watch
Figure 2:
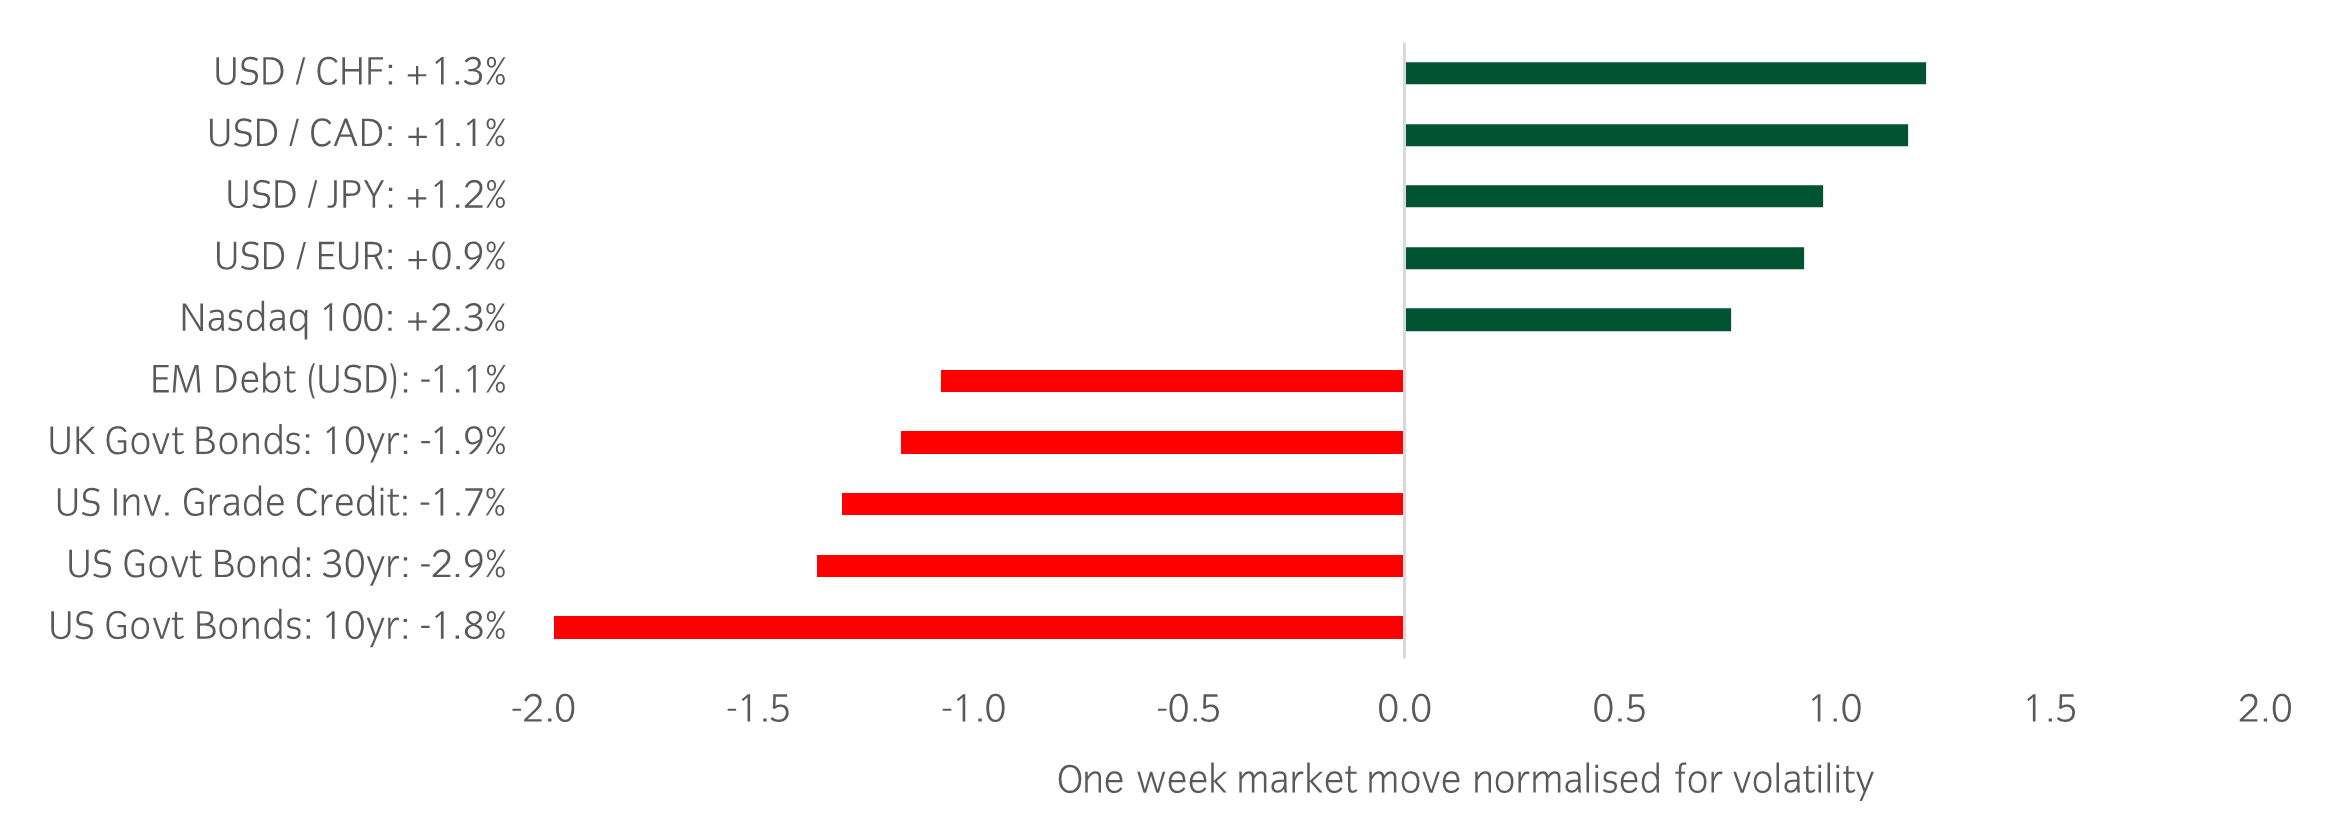
Source: Bloomberg and Insight as at 11 April 2024.The price movement of each asset is shown next to its name. The data used by the bar chart divides the price movement by the annualised historical volatility of each asset.
In a busy week, here are two things that caught our eye:
- A higher-than-expected CPI print on Wednesday highlighted an interruption to the disinflation trend and the challenge of the ‘last mile’ towards target. While the overshoot came primarily from auto insurance/repair and hospital prices, the majority of drivers are at least heading in the right direction. As our chart of the week highlights, rate cut expectations continue to be pushed out and fixed income markets more broadly suffered, particularly in the US.
- Conversely, Thursday’s PPI report was slightly better than forecast and while bonds remained weak, it helped spark a recovery for equities. Leadership came from the tech platform companies, while those that normally benefit from a cyclical upturn (smaller cap, operationally leveraged companies) lagged due to the prospect of fewer expected rate cuts. Next week brings the start of the earnings season, with all eyes on whether the leadership from tech can permeate more broadly.
Winners & losers: A choppy week as markets grappled with continued growth resilience and expectations for less rate cuts. The USD was the clear outperformer, with the USDJPY topping 153 (a 30yr high) and USDCHF continued its march higher. Equities held up relatively well in light of the interest rate moves. The biggest losers were in fixed income, with US 10yr government bonds -1.8%.
Chart of the week
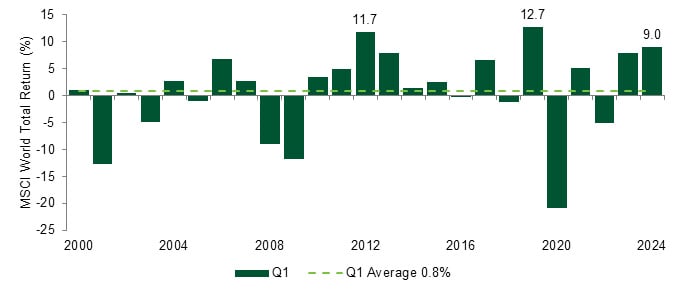
Figure 1: Equities record 3rd best start to a year since turn of the century
Source: Insight and Bloomberg. Data as at 31 March 2024.
- The first quarter of 2024 will go down as an impressive one from a risk asset perspective. As our chart shows, the MSCI world index recorded its third best Q1 since the start of the century.
- Much has been written about continued excitement around AI, and the ‘Magnificent 7’. Almost by definition, most stocks lag their index when the mega caps are leading, but breadth has improved and a range of stock markets, across multiple continents, ended the quarter at, or close to, all-time highs.
- Eleven of the 23 major indices we track have hit all-time highs in the last 100 days. The numbers do not quite match the heady heights of the NASDAQ bubble in 2000 (17 out of 23) or the bull market prior to the Great Financial Crisis (15 out of 23) but it’s an impressive count, nonetheless.
Market watch
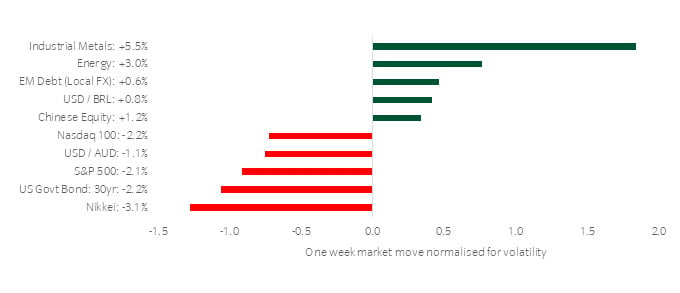
Source: Bloomberg and Insight as at 4 April 2024.The price movement of each asset is shown next to its name. The data used by the bar chart divides the price movement by the annualised historical volatility of each asset.
In a busy week, here are three things that caught our eye:
- The resilient growth backdrop continued with further support from the ISM US manufacturing PMI in March, which moved into expansionary territory. The ISM for March came in well above expectations at 50.3, its first time over 50 in 17 months. Four of the five subcomponents of this index are now positive on a 3-month view, led by new orders (51.4) and production (54.6).
- A hot US jobs report on Friday highlighted just how tight the labour market remains. The US economy added 303k jobs in March, well above expectations of +214k, pushing unemployment back down to 3.8%. While a good sign for US workers, the Fed remains at a crossroads between pre-emptive rate cuts and a hot economy that risks reigniting inflation.
- The commodity complex continued to push higher, led by oil and gold. Geopolitical risks, among other things, have driven Brent Crude above $91/bbl for the first time since last October. This marks a +4% weekly move and +18% since the start of the year. The driver behind the move in gold (+4% WTD, +12% YTD) is less clear, as this has happened despite typical headwinds such as rising real rates.
Winners & losers: A choppy week as markets grappled with stronger growth and higher rate expectations. Commodities were the clear outperformer, with industrial metals and energy topping the table, while equities struggled to mimic the strength of the first quarter. The big winners year to date gave back some gains with the Nasdaq -2.2% and Nikkei -3.1%, while the S&P 500 finally ended its remarkable run of 5 months without a drawdown larger than 2%.
 Australia


