 United States


Contents
- A potentially lower risk growth bucket, without sacrificing expected returns
- High yield default rates have been lower than you may think
- A "free" liquidity premium
- It could be time to consider pivoting your growth bucket to high yield
A potentially lower risk growth bucket, without sacrificing expected returns
With the “Fed put” now in the rear-view mirror, we have seen asset allocators shift long-term equity return expectations down to a 6% to 8% pa range, similar to high yield (which currently yields 8% to 9%)1.
This is more consistent with history. It may surprise you that this century (i.e. since 2000), equities have returned 6.7% pa, and high yield has returned a very close 6.2% pa. Despite this, high yield has been far less volatile, with a 9% annualized standard deviation, versus equities at 16%2.
The dispersion of outcomes (a better measure of risk in our view) has been narrower for high yield. This is even more pronounced when limiting the high yield universe to bonds rated B- or higher with maturities of less than five years (Figure 1).
Figure 1: Over 5-year investment horizons, high yield has delivered near-equity returns with lower dispersion
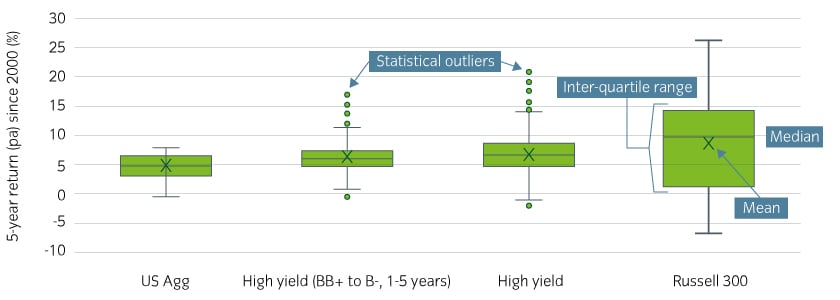
Source: Bloomberg, Insight calculations, March 2023. Past performance is not indicative of future results. Investment in any strategy involves a risk of loss which may partly be due to exchange rate fluctuations.
The (maximum-minimum) range for equity was ~30%, about twice the HY range of ~15%. The Inter-Quartile-Range (IQR) of equity is more than three times as large as that of high yield.
Historically, high yield has also tended to benefit from more benign drawdowns during risk market sell-offs (Figure 2). This is partly because high yield bonds are senior to equity in the capital structure and generally have defined maturity structures, resulting in the “pull-to-par” effect: a maturing bond not in default will return principal. In equities there is no such guarantee, which can result in depressed valuations for extended periods.
Figure 2: High yield has historically recovered faster from drawdowns
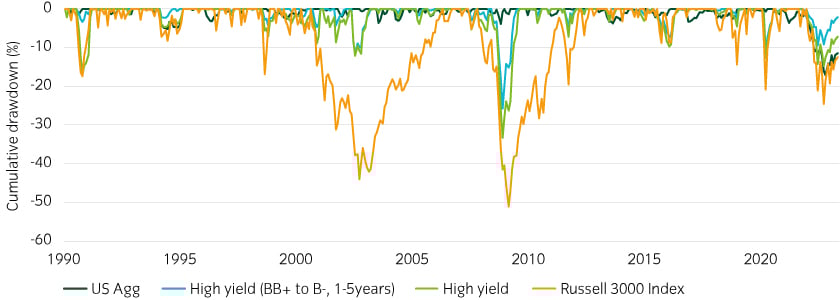
Source: Bloomberg, Insight calculations, March 2023, Russell 3000 index, Bloomberg US Corporate High Yield Index and Bloomberg BB+ to B- US Corporate High Yield Index. Past performance is not indicative of future results. Investment in any strategy involves a risk of loss which may partly be due to exchange rate fluctuations.
High yield default rates have been lower than you may think
Defaults are the main risk for high yield investors, as they threaten permanent losses of capital. However, consensus default predictions consistently exceed realized defaults in high yield indices. Ratings agency default expectations are typically in the range of 3% to 5% pa. But broad high yield index defaults since 2004 have averaged ~2.3% pa on a par-weighted3 basis (Figure 3). This is because Moody’s and S&P default metrics cover all speculative grade investments they provide ratings for. But these universes are wider ranging than what is included in the most indices, and thus unrepresentative of most institutional high yield portfolios.
Figure 3: High yield defaults in broad high yield indices have been contained
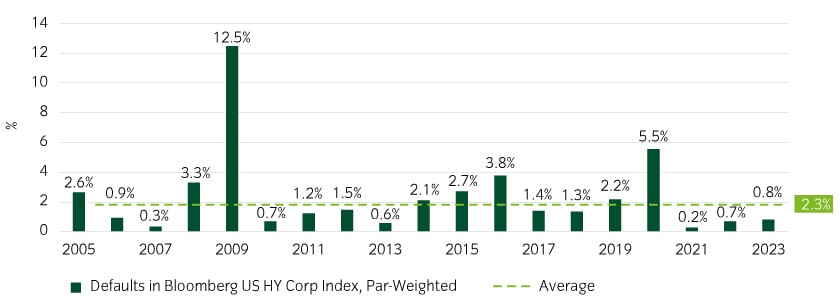
Source: Bloomberg, Insight calculations, March 2023
Further, recovery rates are often forgotten. Loss-given-default (LGD) is a more important metric than default. High yield recovery rates have been ~45% on average, resulting in a realized average LGD of ~1.5%4.
When adjusting for average LGD, historically we have seen strong predictive power from initial option-adjusted spreads (OAS) and realized returns, indicative of the contractual nature of bond market returns.
This is demonstrable using the definition Expected Excess Return = Starting OAS– Expected LGD (Figure 4).
Figure 4: Adjusting for LGD, spreads have strongly predicted returns
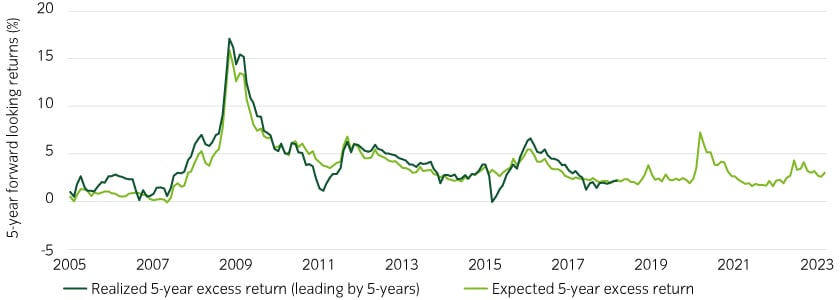
Source: Bloomberg, Insight calculations. Using long-term average 1.5% for expected LGD after March 2023.
A "free" liquidity premium
The high yield market is infamous for its poor liquidity. This is certainly true when trading bonds over-the-counter (which is how almost all managers operate – Figure 5). The high transaction costs incorporating the additional illiquidity premium is a key factor behind the median high yield fund underperforming the broad index by ~50bp pa, net of fees.
However, innovations in portfolio construction and implementation technology that leverage the ETF infrastructure can allow investors to trade large, customized baskets of high yield bonds seamlessly to build a diversified and highly liquid high yield portfolio. We recognized this hidden pool of liquidity early on in 2012 and catered our investment process to benefit from this trend.
For years, we worked side-by-side with the sell-side community to improve their understanding as well to grow the “credit portfolio trading” market overall. As long as there is a vibrant ETF ecosystem, we are able to tap into this source of liquidity at a fraction of prevailing market bid/ask spreads.
Figure 5: Investors with in-depth knowledge of the ETF ecosystem can overcome liquidity constraints within high yield
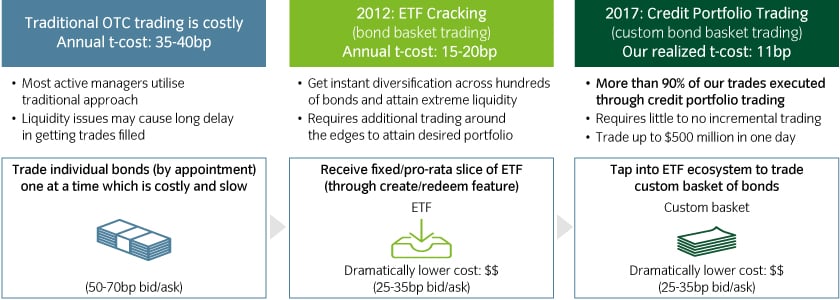
Source: For illustrative purposes only. Process presented represents that of predecessor firm Mellon Investments Corporation. Hypothetical trade example: actual trading may reflect prices from banks, bids and offers that are materially different than what is shown herein.
Importantly, investors that are able to leverage these innovations can essentially earn the asset class’s illiquidity premium for free.
It could be time to consider pivoting your growth bucket to high yield
During the quantitative easing era, equity allocations were well rewarded. However, in a post-QE world of normalized rates and the disappearance of the Fed put, the equity market is becoming a wilder ride. TINA (there is no alternative to equities) is dead.
We believe high yield – which for the first time in years lives up to its name with a current yield of ~8-9% – can play a particularly useful role in a pension plan’s portfolio. It can help grow the portfolio, add a measure of duration exposure and provide sizable and predictable cash flows to help meet obligations as they fall due.