
Executive summary
- US tariff rates continue to change but appear to be settling around an average effective percentage level in the high teens.
- As a result, tariffs are providing monthly revenue of $29bn for the US Treasury Department, up from an average last year of $8bn.
- Over the next decade, additional tariff revenues should reduce the budget deficit by around 0.6% of GDP each year.
- However, the scale of US debt relative to its GDP remains unsustainable, given new spending plans and ongoing budgetary obligations.
State of play
The release of the latest US tariff announcements means we are beginning to receive a better picture of the contours of a future US trade regime. That said, it is not a zero possibility that the recently announced tariff rates numbers will undergo adjustments as countries scramble to strike deals with the US, notwithstanding President Trump’s mercurial negotiating style. For the moment, the biggest outstanding questions relate to US-China trade, where talks are ongoing. Importantly, China has significant leverage over the United States, given its stranglehold over rare-earth metals. As a result, we think a return to the high tariff levels imposed by each party in the aftermath of “Liberation Day” is unlikely.
Figure 1: Reciprocal tariffs on imports into the US from trading partners1
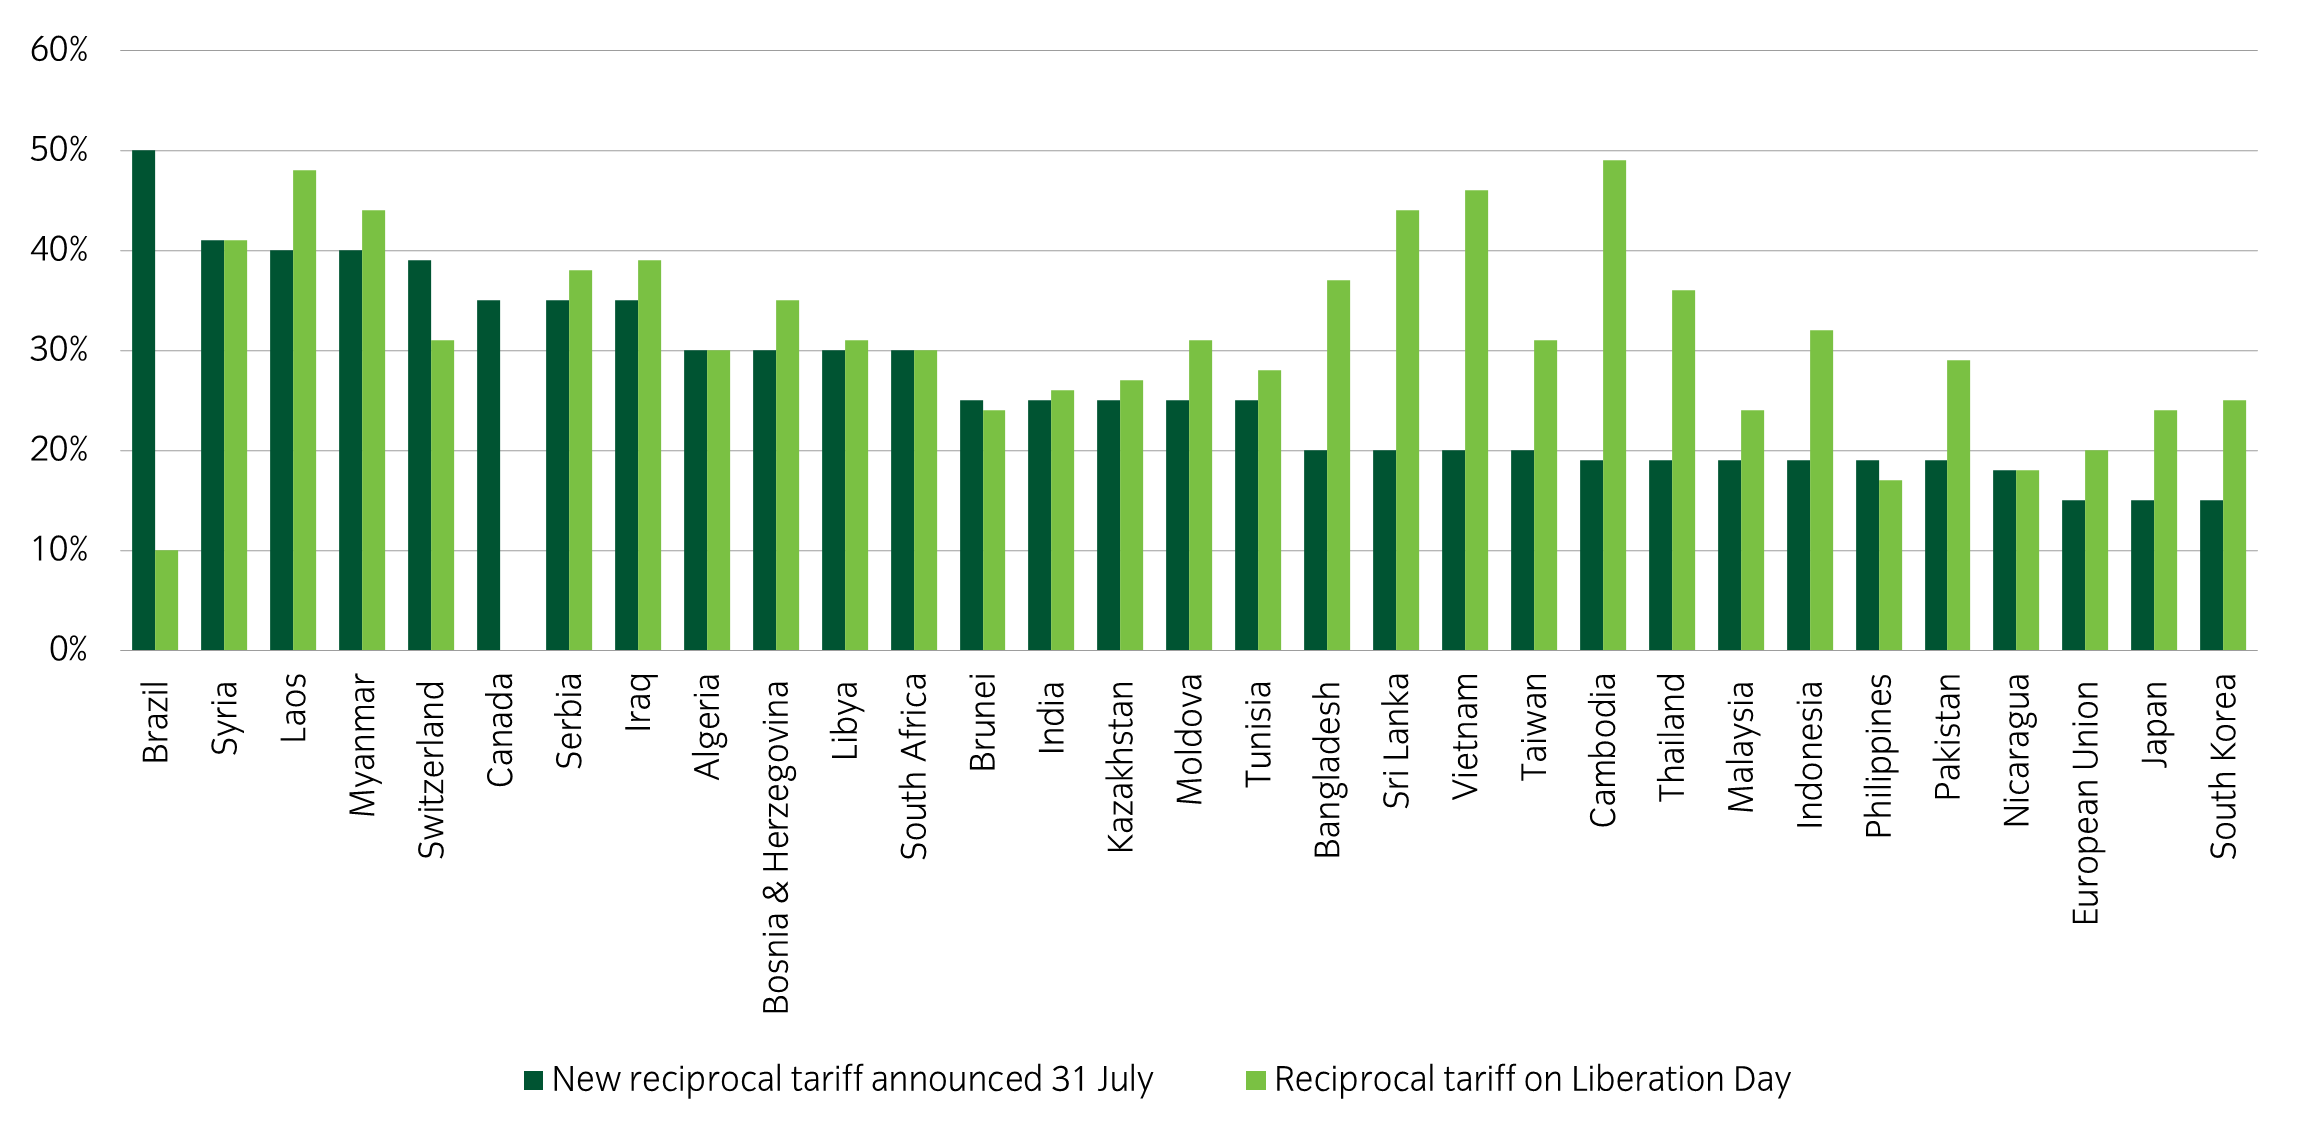
Relative to the rest of the world, the UK, facing the minimum tariff rate of 10% on goods, is at somewhat of an advantage versus other countries running trade surpluses with the US. Accordingly, the EU, Japan and South Korea are subject to the worldwide minimum 15% tariff applied to economies with trade surpluses. Meanwhile, Switzerland faces the highest tariff level (39%) of major economies that are not driven by political disputes, such as Brazil which is subject to 50%. There are some carve outs for countries with deals, including the USMCA agreement with Canada and Mexico. Overall, though, the level of tariffs is not very different from that announced on the 2nd April, and remains significantly higher than last year.
Figure 2: US average tariff rate2
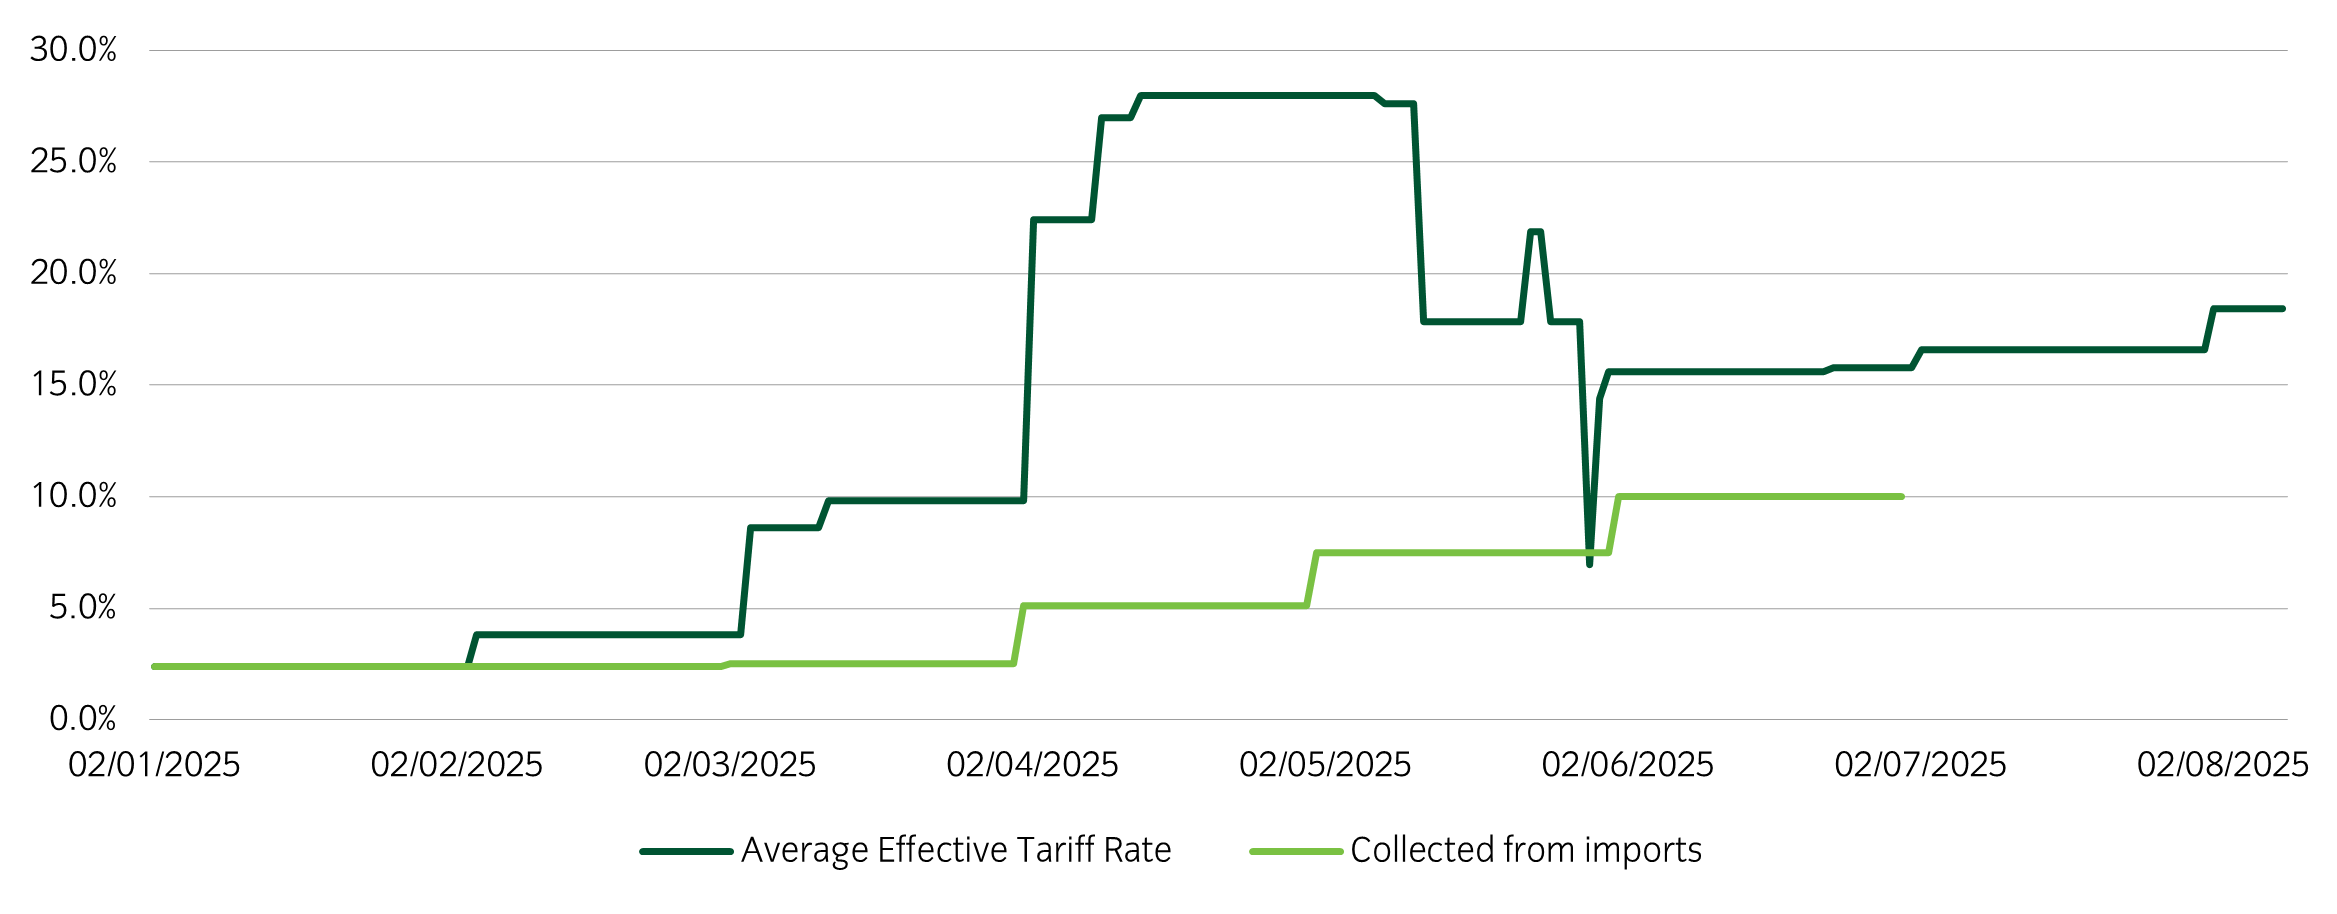
Looking forward, it is anticipated that further tariff increases may be implemented on targeted goods such as pharmaceuticals and semiconductors. Market participants, for the present, appear to be treating these changes as a structural adjustment to which they must adapt. This response may have encouraged policymakers to persist with the current tariff trajectory. While there has been a short-term rebound in confidence indicators, the introduction of higher tariffs will exert upward pressure on inflation, likely peaking in the coming year due to inventory adjustments, and will act as a regressive tax, marginally dampening economic growth during the latter half of the year.
Revenue impact
To assess the utility of the US new, tariff friendly trading regime, there are two questions with which we must grapple: Firstly, how much revenue is the US government likely to collect from tariffs? Secondly, how do these revenues compare with the impact of the recent budget bill passed by Congress?
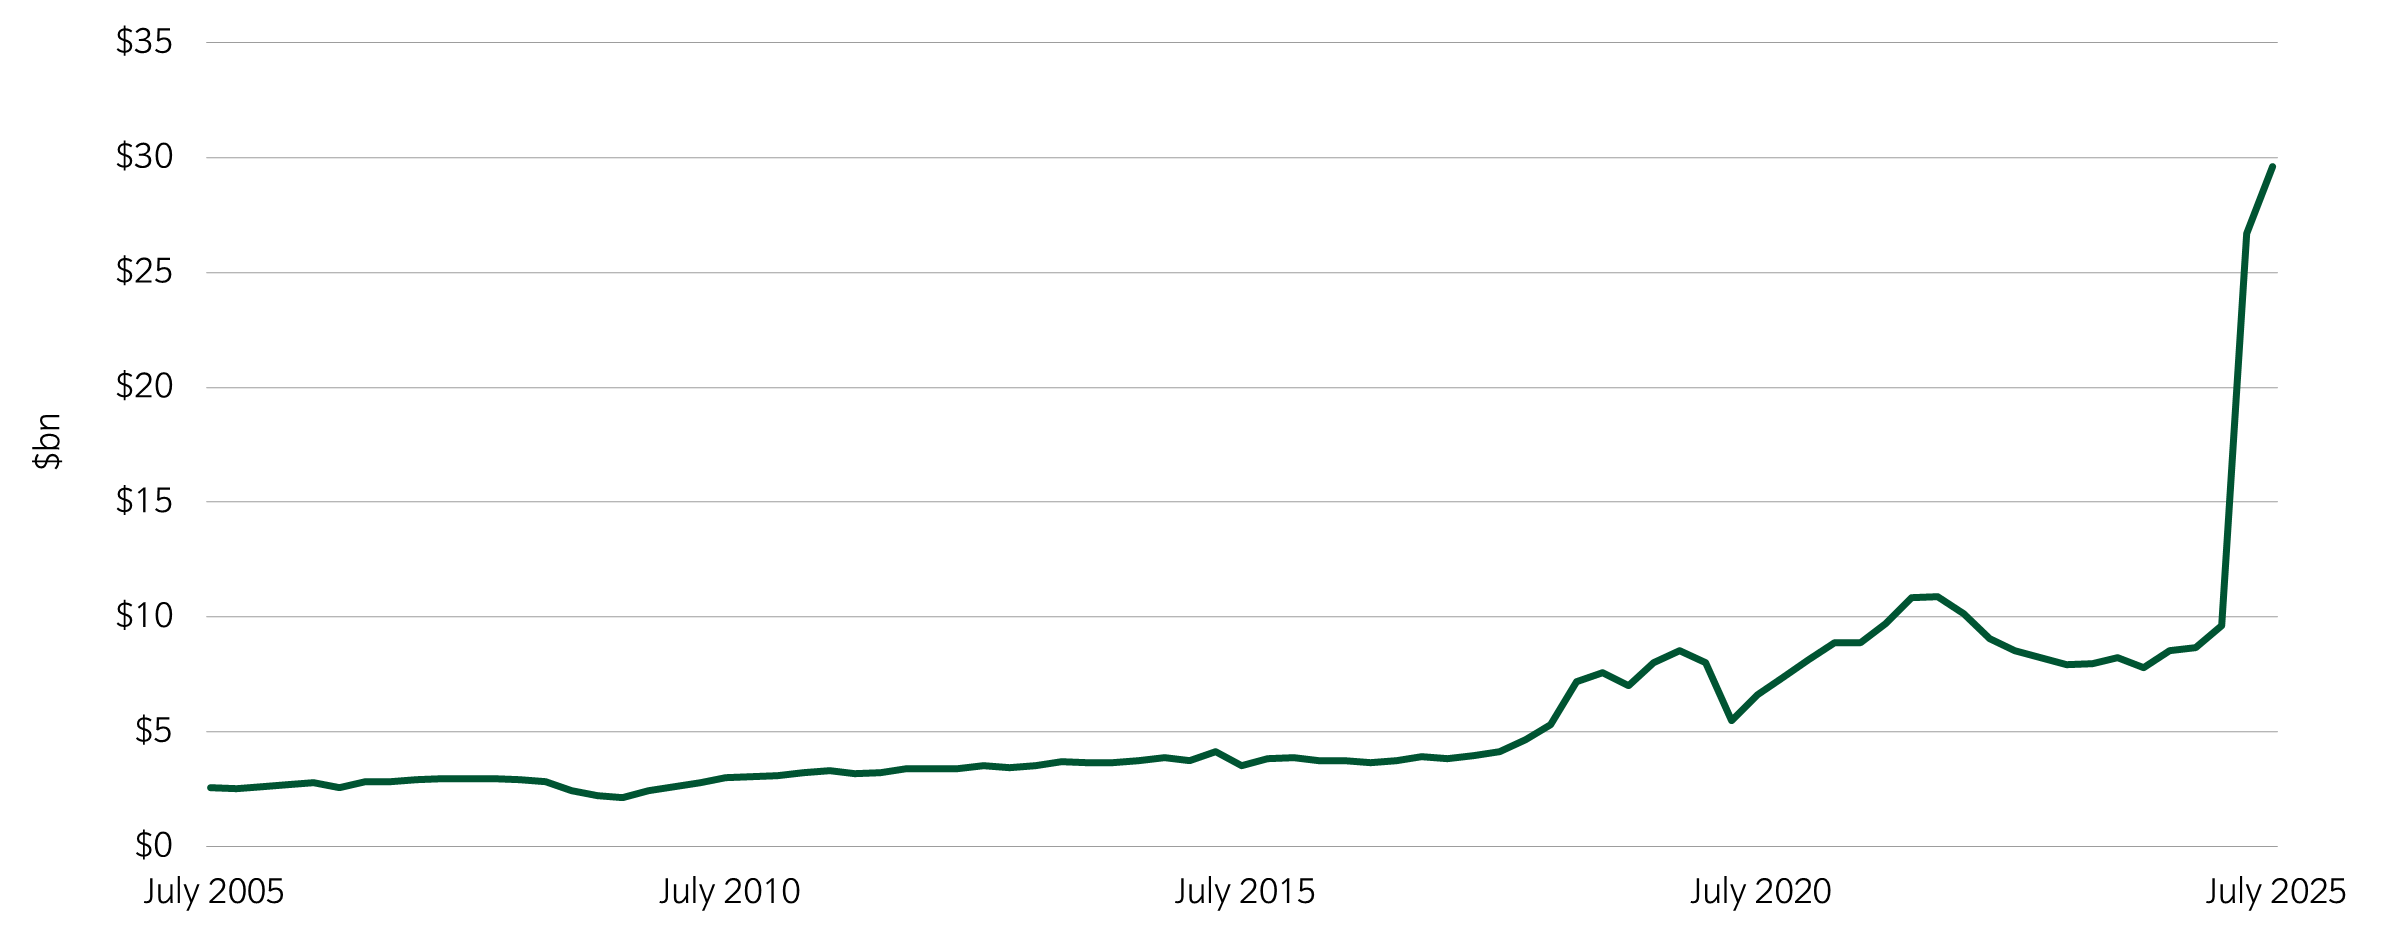
Regarding revenue collection, the implementation of tariffs has resulted in a notable increase in customs revenues. Monthly collections rose from $8.7 billion in July of the previous year to $29 billion as of July 30th. To illustrate, by July 30th this year, the United States accumulated $126 billion in customs duties, surpassing the total of $98 billion collected throughout the entire previous year.
Figure 3: US Customs and certain excise taxes, monthly collections3
According to Yale’s Budget Lab, projecting this into the future and factoring in dynamic effects such as trade substitution, the chart displays the increase in revenues relative to prior tariff levels.
Figure 4: Estimated revenue effects of all 2025 tariffs, $bn2
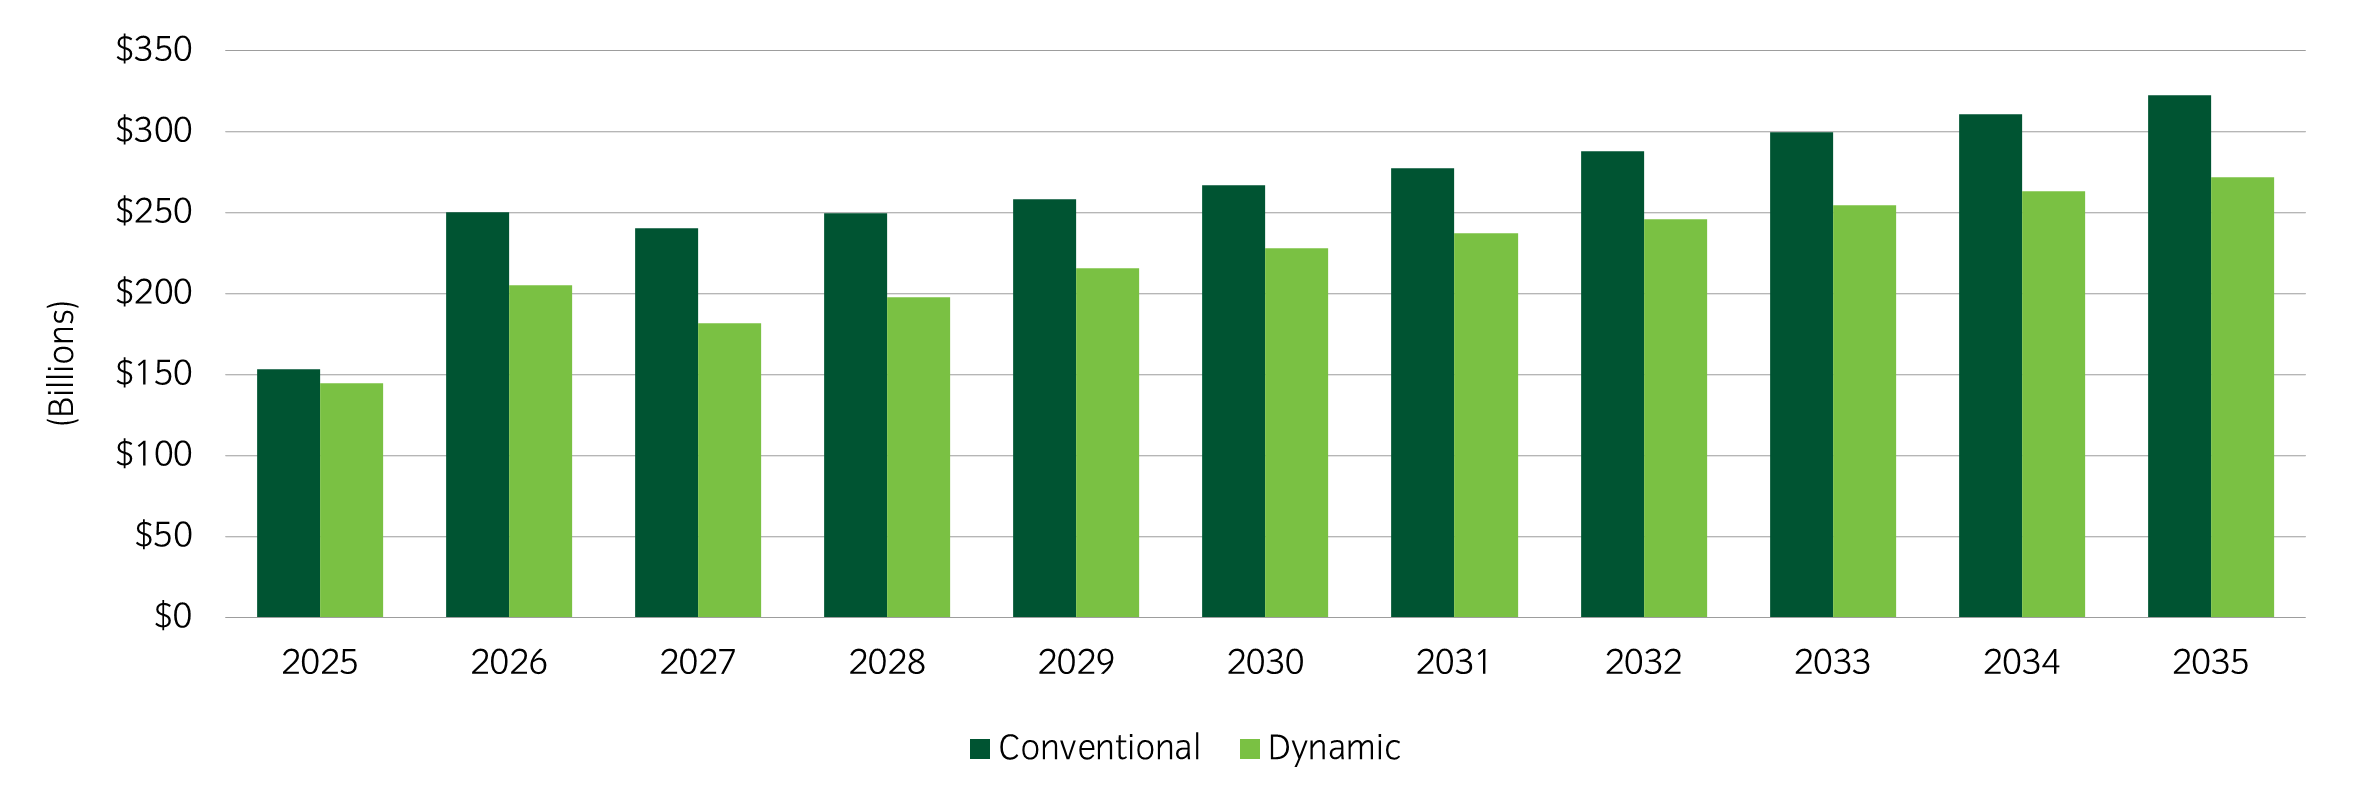
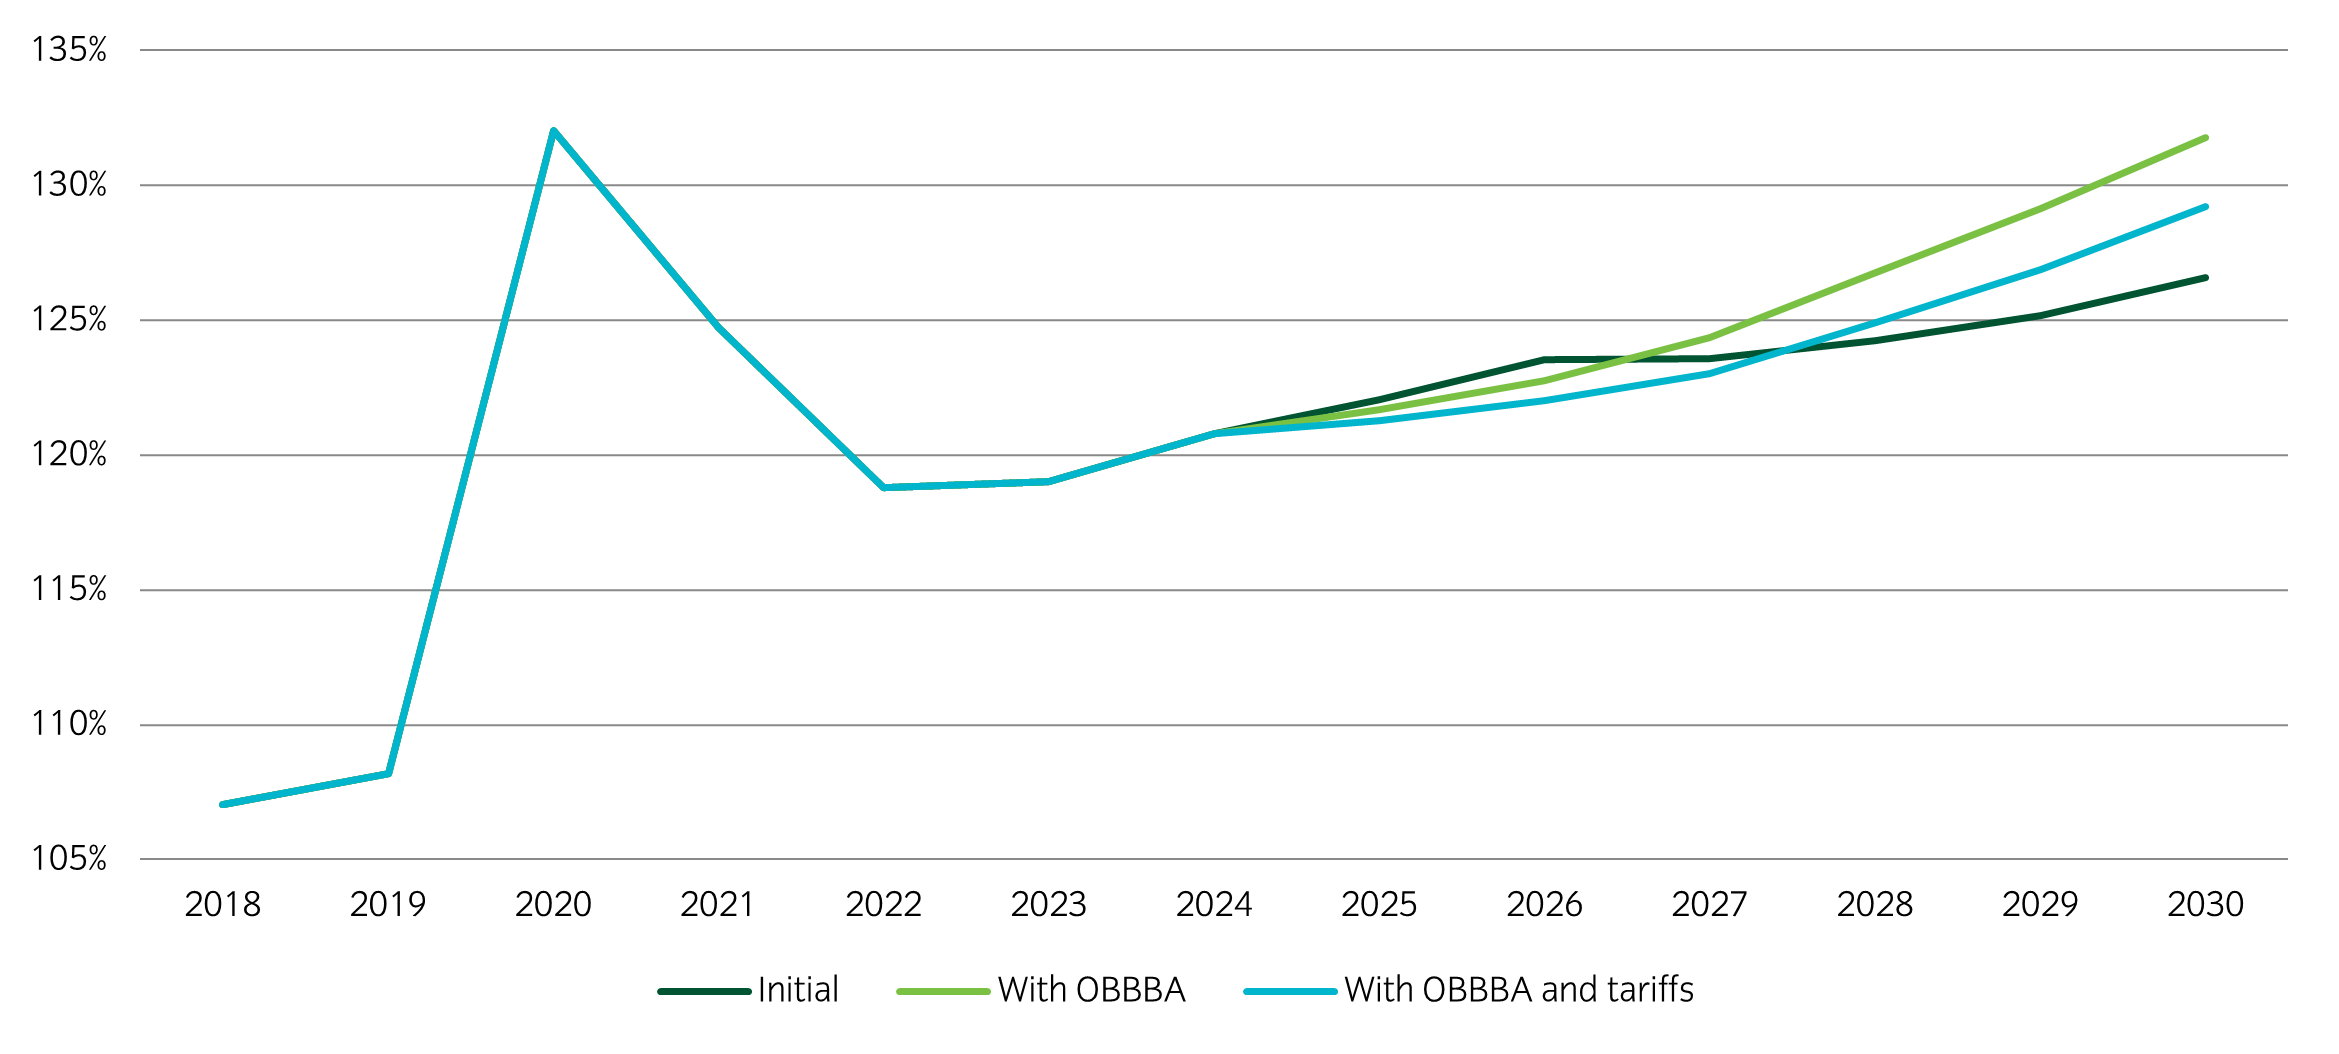
As a result, on average, between 2026 and 2035, tariffs will raise an additional 0.74% of GDP in revenue, which decreases to 0.62% when dynamic effects are included. This figure offsets approximately half the fiscal effect of the One Big Beautiful Bill Act (OBBBA), given the potential for the bill’s spending plans to increase fiscal costs. As a result, the US budget deficit is expected to average around 6.5% of GDP over the next decade, which means the scale of the US federal debt relative to GDP will remain on an unsustainable path.
Figure 5: US Debt to GDP projections under three scenarios5