

Executive summary
- UK tax and spending levels are not excessive when compared with other major developed economies
- Welfare spending, while higher in recent years, is expected to stay broadly stable as a share of GDP going forward
- Labour taxation is the lowest in the G7 for low-to-average wages, though top rates are relatively high
- The UK budget deficit is set to improve, helping to stabilise the debt-to-GDP ratio
- Current market pessimism – reflected in a steeper gilt yield curve and weaker sterling – could reverse if growth surprises to the upside
Concerns over UK fiscal sustainability appear overdone
As highlighted in our paper Fiscal fault lines: a global review of sovereign fiscal health, the UK's public finances appear risky, though far from the most concerning globally. Countries such as the US, France and Belgium face significantly less sustainable fiscal dynamics. While the UK carries a relatively high debt-to-GDP ratio, it is expected to reduce its budget deficit over the next five years, in contrast to some other countries. This adjustment should stabilise debt levels, setting the UK apart from many international peers.
Figure 1: UK debt/GDP has grown significantly1
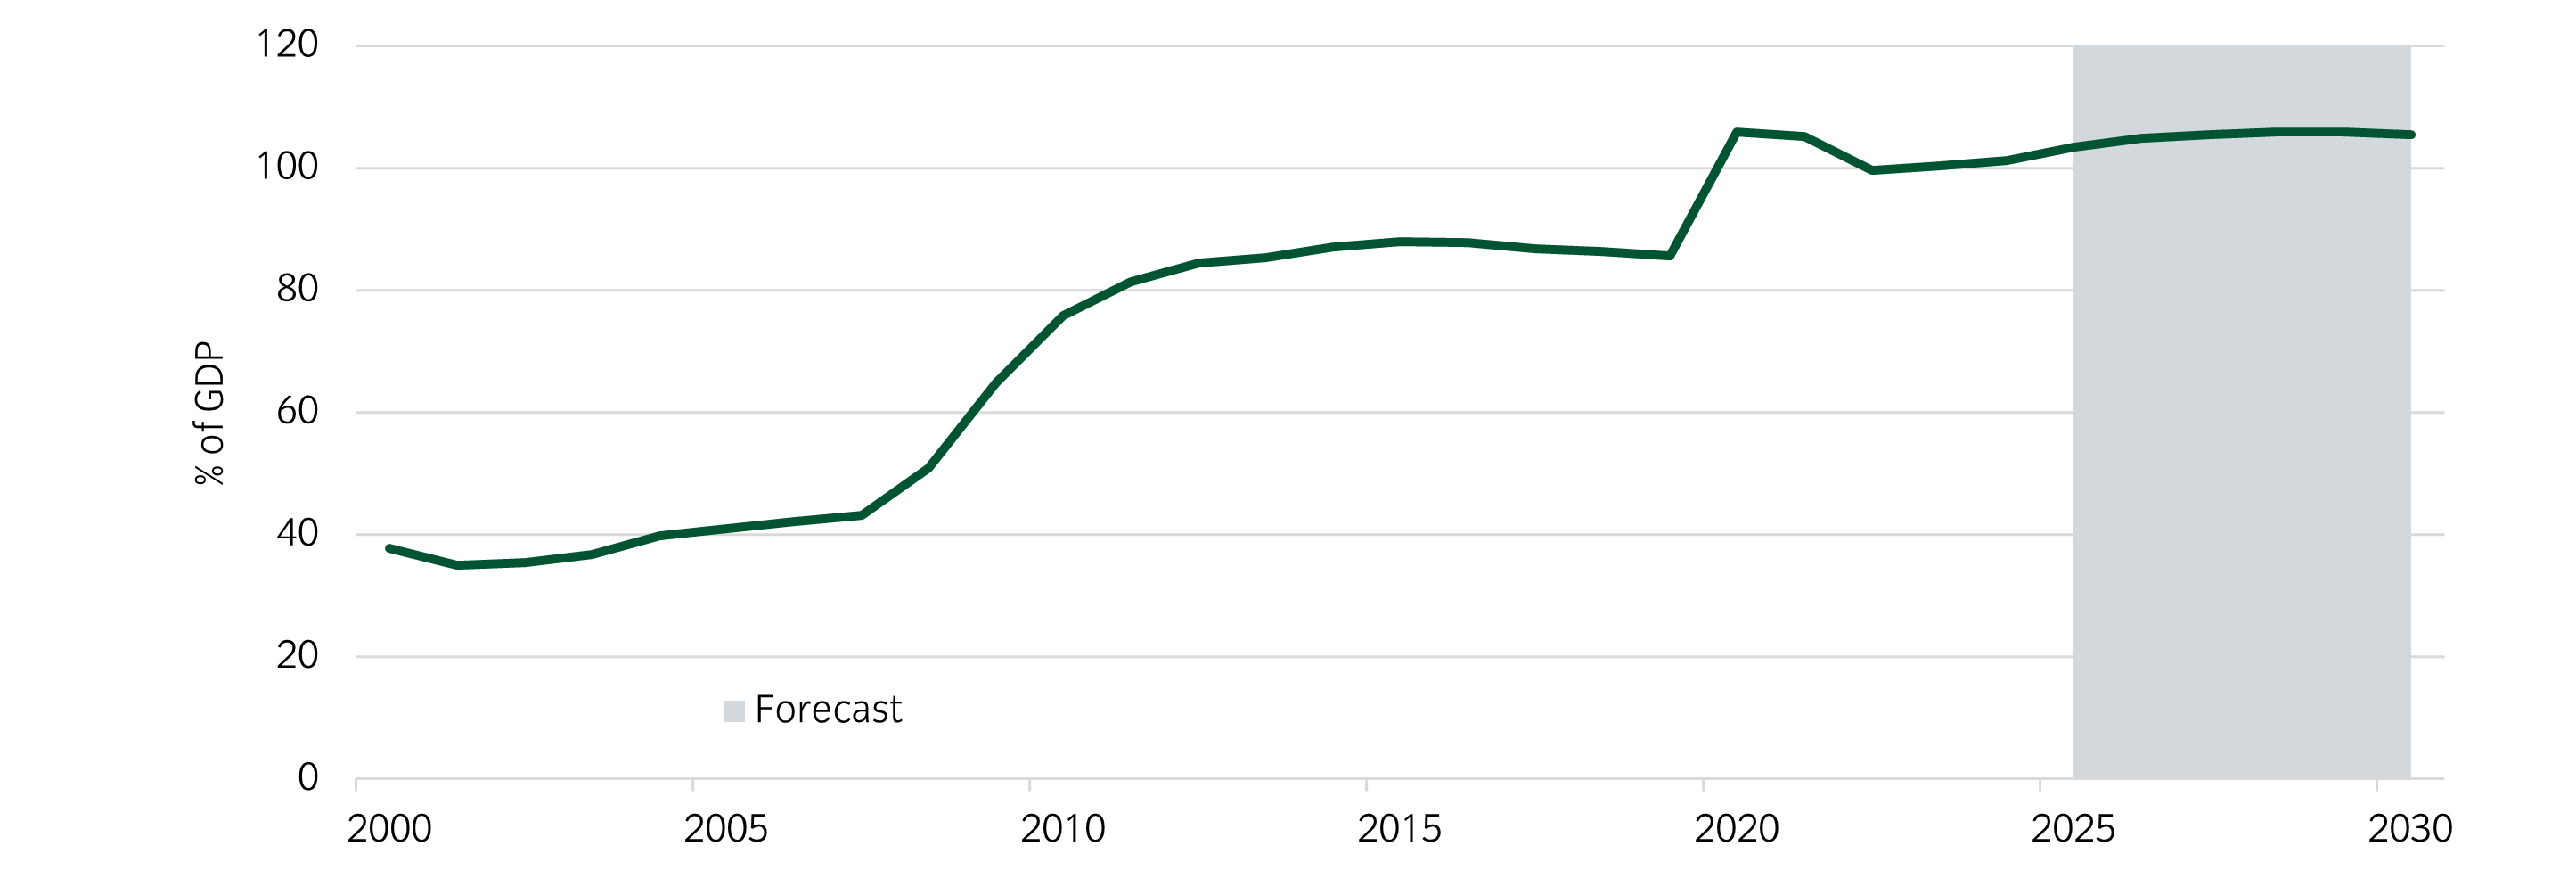
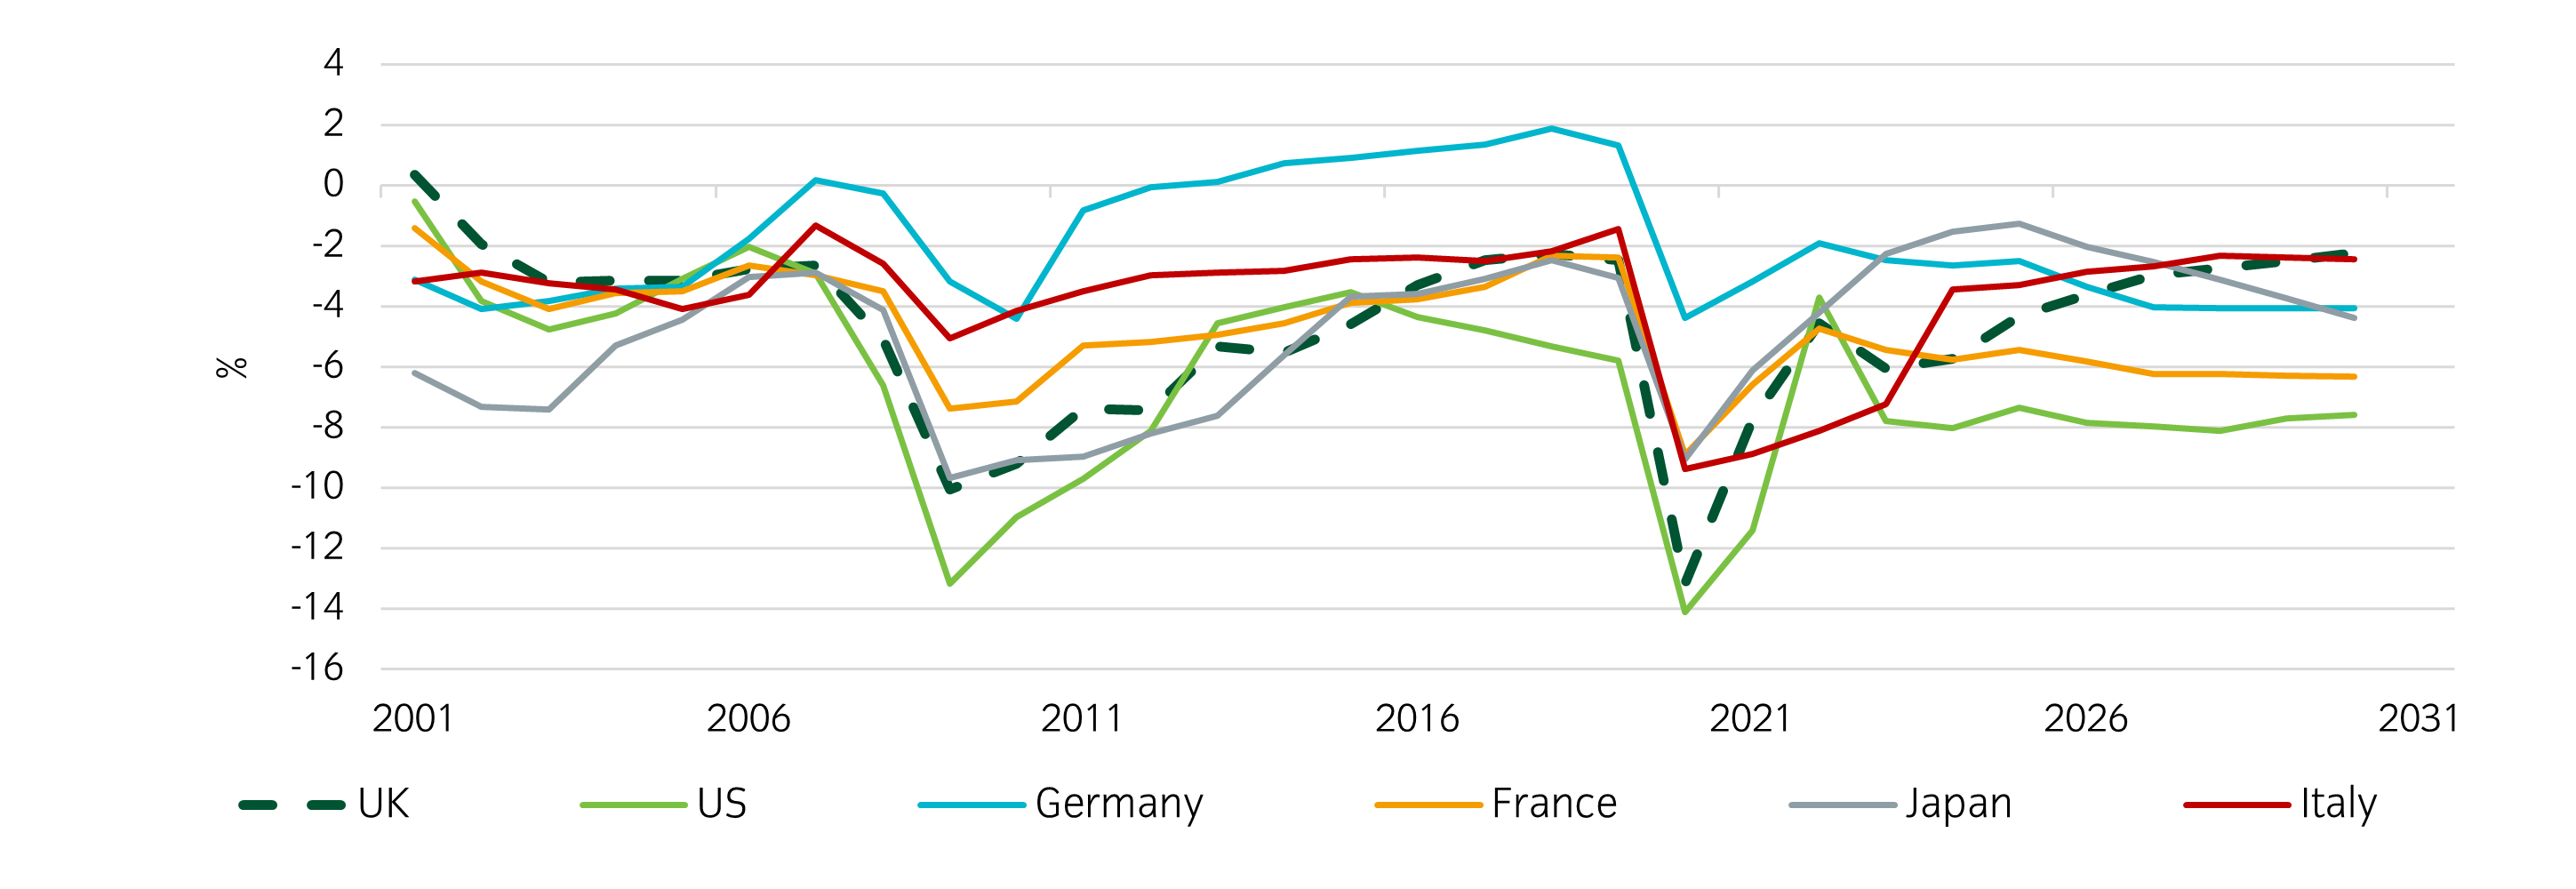
Figure 2: The UK budget balance is projected to improve1
The UK sits roughly in the middle of the G7 when it comes to tax revenues and government spending. Typically, it raises and spends less than most European countries, but more than non-European peers and the OECD average.
There is nothing inherently problematic about this position. The overall scale of taxation and government spending is ultimately a political choice. The UK occupies a middle ground between more social-democratic European nations and smaller-government advanced economies outside Europe, reflecting its own social contract.
Spending is stabilising, but pandemic spending still not unwound
According to the Office for Budget Responsibility (OBR), the 2025 Budget will keep spending at a similar share of GDP over the next five years, while revenues are expected to rise by a couple of percentage points of GDP – leaving the UK in a midway position internationally.
Looking more closely at how spending and revenues break down, the OECD provides an international comparison of government spending by category, and we outline the major categories from the latest 2023 data in Table 1.
Table 1: Spending vs G7 average2

Like most countries, the UK saw a sharp rise in government spending during the pandemic, which has only partially unwound. Key areas of increased expenditure include:
- General public services – covering the cost of running government, parliament, and embassies. There should be scope for efficiency improvements in these areas to return spending levels closer to pre-pandemic levels.
- Fuel and energy – in line with most of Europe, fuel and energy costs, which form part of the economic affairs line, have risen by 1.2% of GDP. This reflects higher energy costs and the need for targeted policies to strengthen supply.
- Health – driven by rising NHS spending, largely due to demographic ageing.
Interestingly, spending on social protection has fallen as a share of GDP between 2013 and 2023. This includes reductions in old-age benefits and a notable drop in family and child-related spending (from 1.6% to 1.1% of GDP). Some of this has been offset by higher costs linked to social exclusion, which likely includes spending on asylum seekers.
Overall, UK social protection spending is around two percentage points below the G7 average, though the range is wide – from 7.9% of GDP in the US to 23.3% in France.
UK revenues are lagging behind
As outlined in Table 2, although the UK’s tax take has risen noticeably over the past decade, it has only reached the weighted OECD average and still sits slightly below the simple G7 average.
What stands out is the UK’s relatively low collection of social security contributions (National Insurance contributions, or NICs) compared with other countries. By contrast:
- income tax and property taxes are somewhat higher than the OECD average; and
- VAT revenue is above the G7 average, skewed by the very low sales tax in the US.
The now-abandoned proposal to raise income tax by 2% and cut NICs by 2% would not have affected employee take-home pay but would have shifted the burden further away from international norms – raising more from property and pension income while reducing reliance on social security contributions.
Even with the increase in employer NICs from April, the UK still collects less from this source than most peers. The OBR report accompanying the budget highlights this, along with other expected revenue increases over time, such as higher income tax receipts due to frozen thresholds.
While taxes and total revenues as a share of GDP are projected to rise to historically high levels for the UK, this would only bring the UK in line with Canada today – still well below major European economies.
Table 2: UK revenues versus G7 average3

Digging deeper into labour taxation, we can examine two measures.
- Personal taxation – income tax plus employee National Insurance contributions.
- Tax wedge – personal taxation plus employer National Insurance contributions.
The OECD provides useful data on average tax rates and tax wedges at different income levels, expressed as a percentage of average wages. This approach allows for meaningful comparisons across countries.
Figure 3: Net personal average tax rate (% of gross earnings versus % of average wage)4
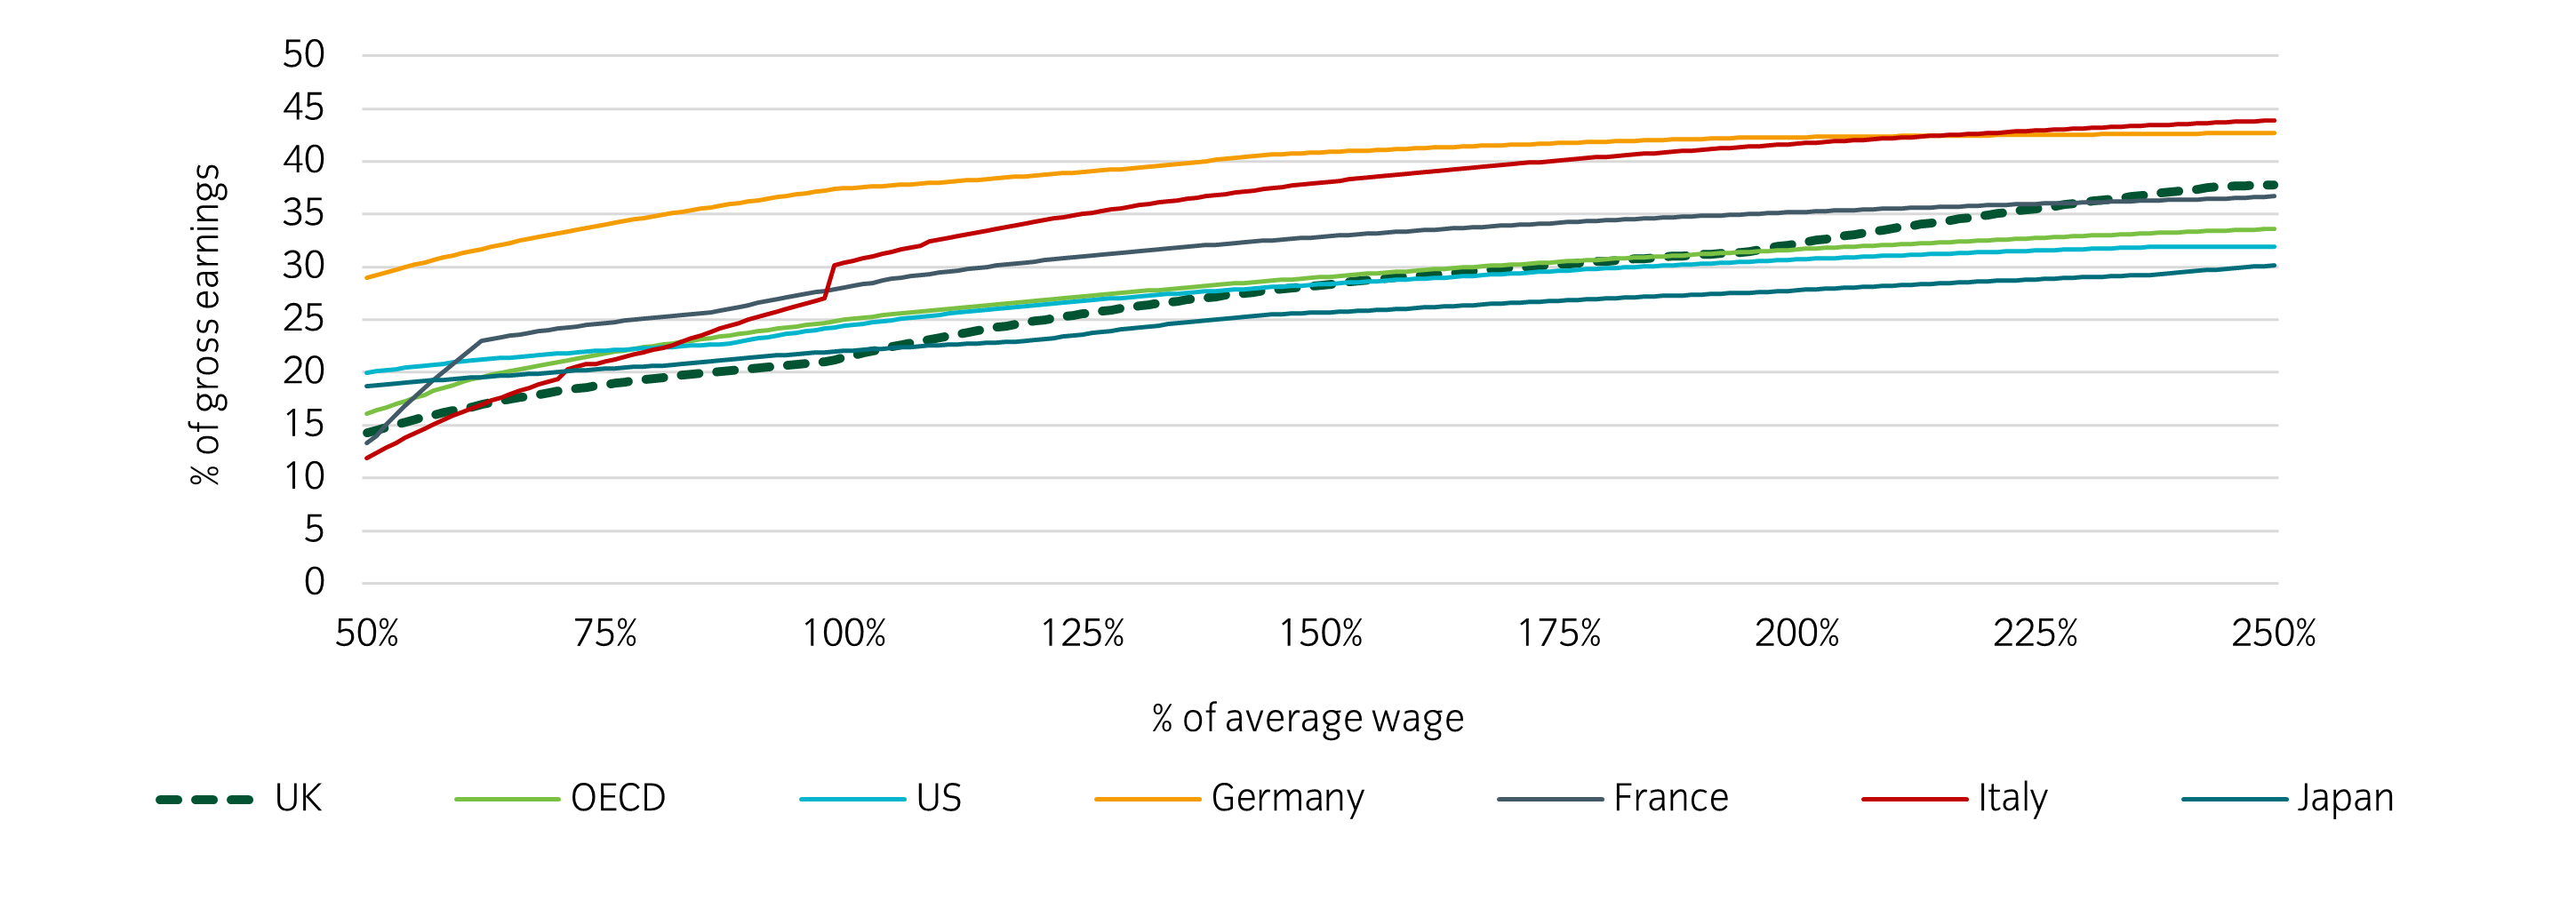
Figure 4: Net average tax wedge (% of labour costs versus % of average wage)4
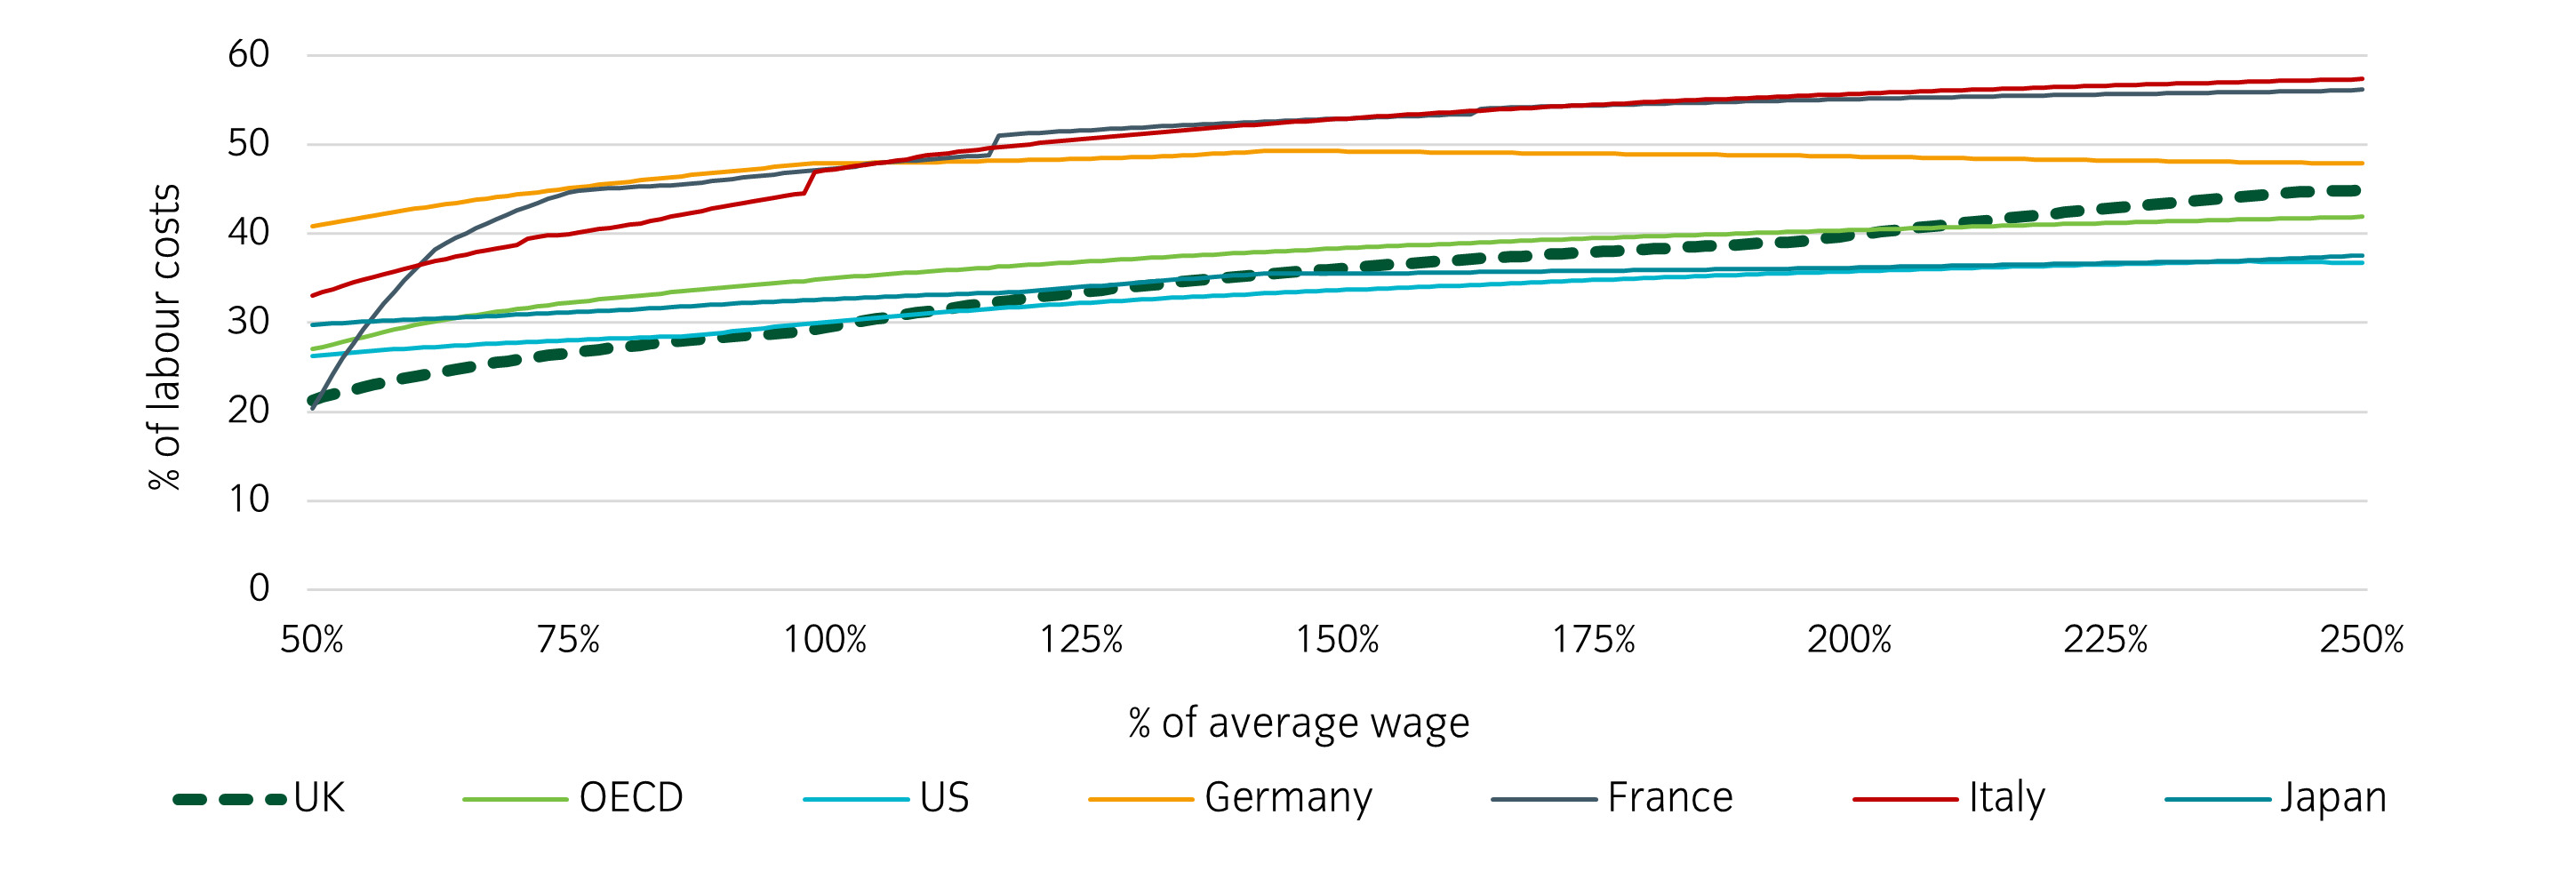
Contrary to common assumptions, the UK has the lowest average personal tax rate in the G7 for incomes between 62% and 104% of average wages – roughly £31,800 to £53,400. When employer NICs are included, the UK also has the lowest tax wedge in the G7 for incomes between 51% and 107% of average wages (£26,200 to £54,900).
In other words, the UK’s tax system is less progressive than many European countries at lower-to-average income levels but becomes the most progressive in the G7 for earnings above the average wage.
Figure 5: Percentage difference in personal tax rate relative to average worker versus % of average wage4
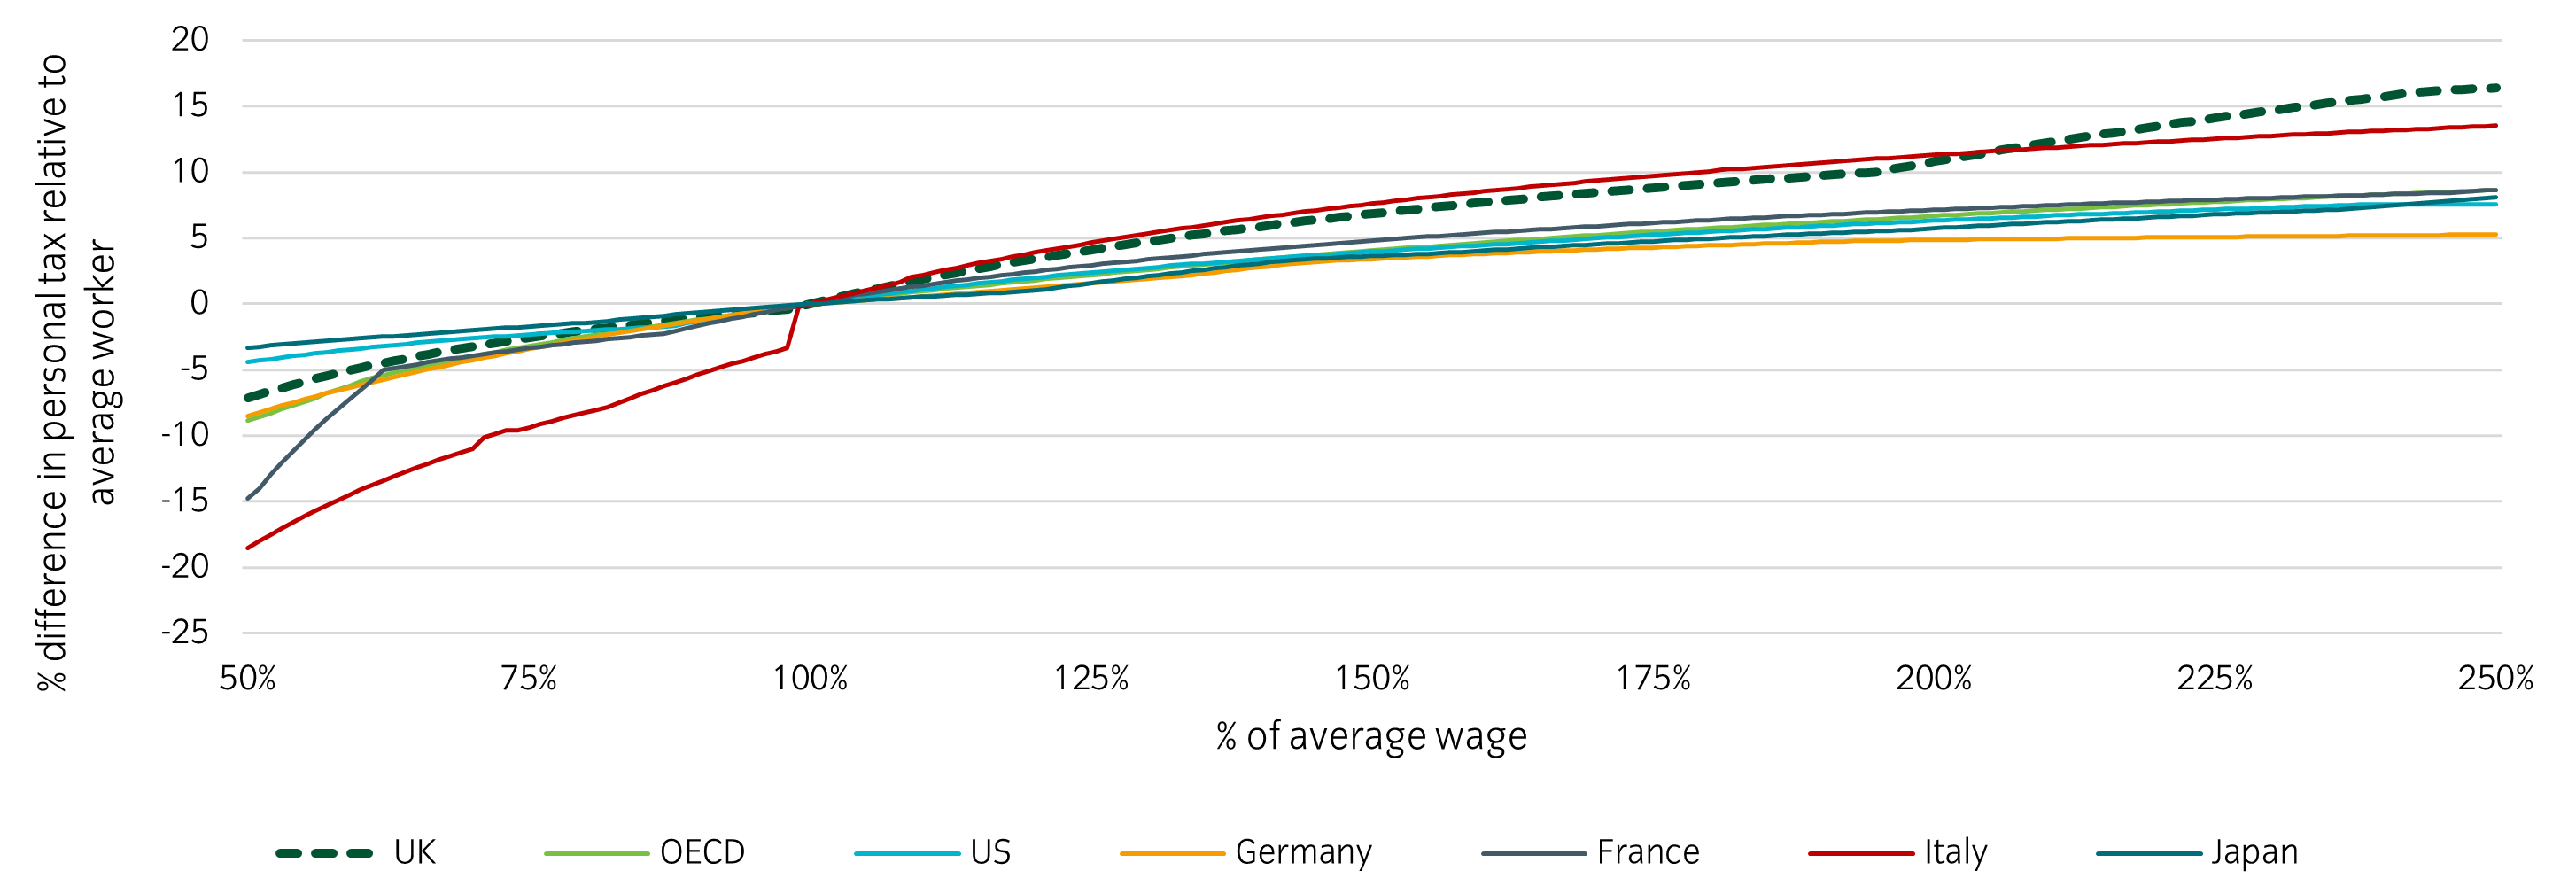
There are solid economic arguments for taxing labour less, as it encourages employment – and the UK appears to follow this approach for average and slightly below-average wage levels.
If the government wanted (or needed) to raise more income tax revenue by international standards, it would likely need to go beyond freezing thresholds and actively lower the higher-rate threshold or, preferably, make an equivalent adjustment to National Insurance.
Finally, given concerns about wealthy individuals relocating to avoid UK taxes, it’s worth noting the UK’s position on top income tax rates. Unsurprisingly, given the previous chart, the UK ranks near the top for taxing high incomes – although France and Italy surpass the UK once social security contributions are included. For context, Hungary and Estonia apply single, very low, income tax rates, while Luxembourg has an astonishing 23 income tax bands.
A steadier position than many of its peers
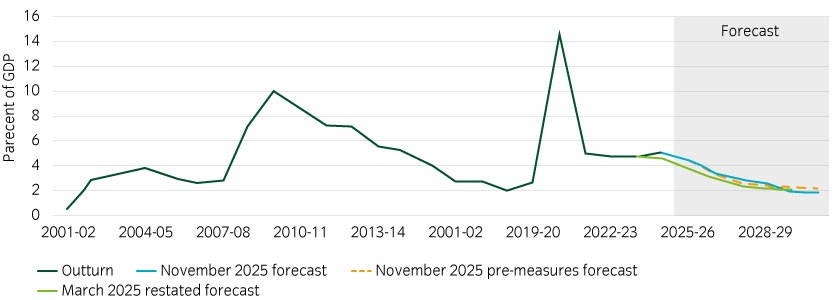
Although the UK still faces fiscal challenges, alongside weak productivity and lingering Brexit effects, its position is stronger than that of many peers. Importantly, while the Budget slowed or backloaded fiscal consolidation, the process is still underway – something that cannot be said for most other countries.
Markets may remain wary of a rapid upward move in gilt yields, as we saw following the Truss-Kwarteng mini-Budget, but politicians appear equally concerned and seem more cautious of market sentiment than in the past.
Figure 6: Public sector net borrowing3
Several factors, including shifts in pension fund demand, help explain the relative steepness of the UK gilt yield curve. However, if fiscal concerns are part of the story, they appear somewhat overstated. An upside surprise in growth would significantly improve the UK’s fiscal outlook and, given current market pessimism, could lead to relative outperformance of gilt yield-curve flatteners. A similar dynamic could also play out in currency markets, benefiting sterling.