 Australia


11 April 2025
Multi-asset
Week to 11 April 2025
Chart of the week
Volatility caused by President Trump’s tariff announcements
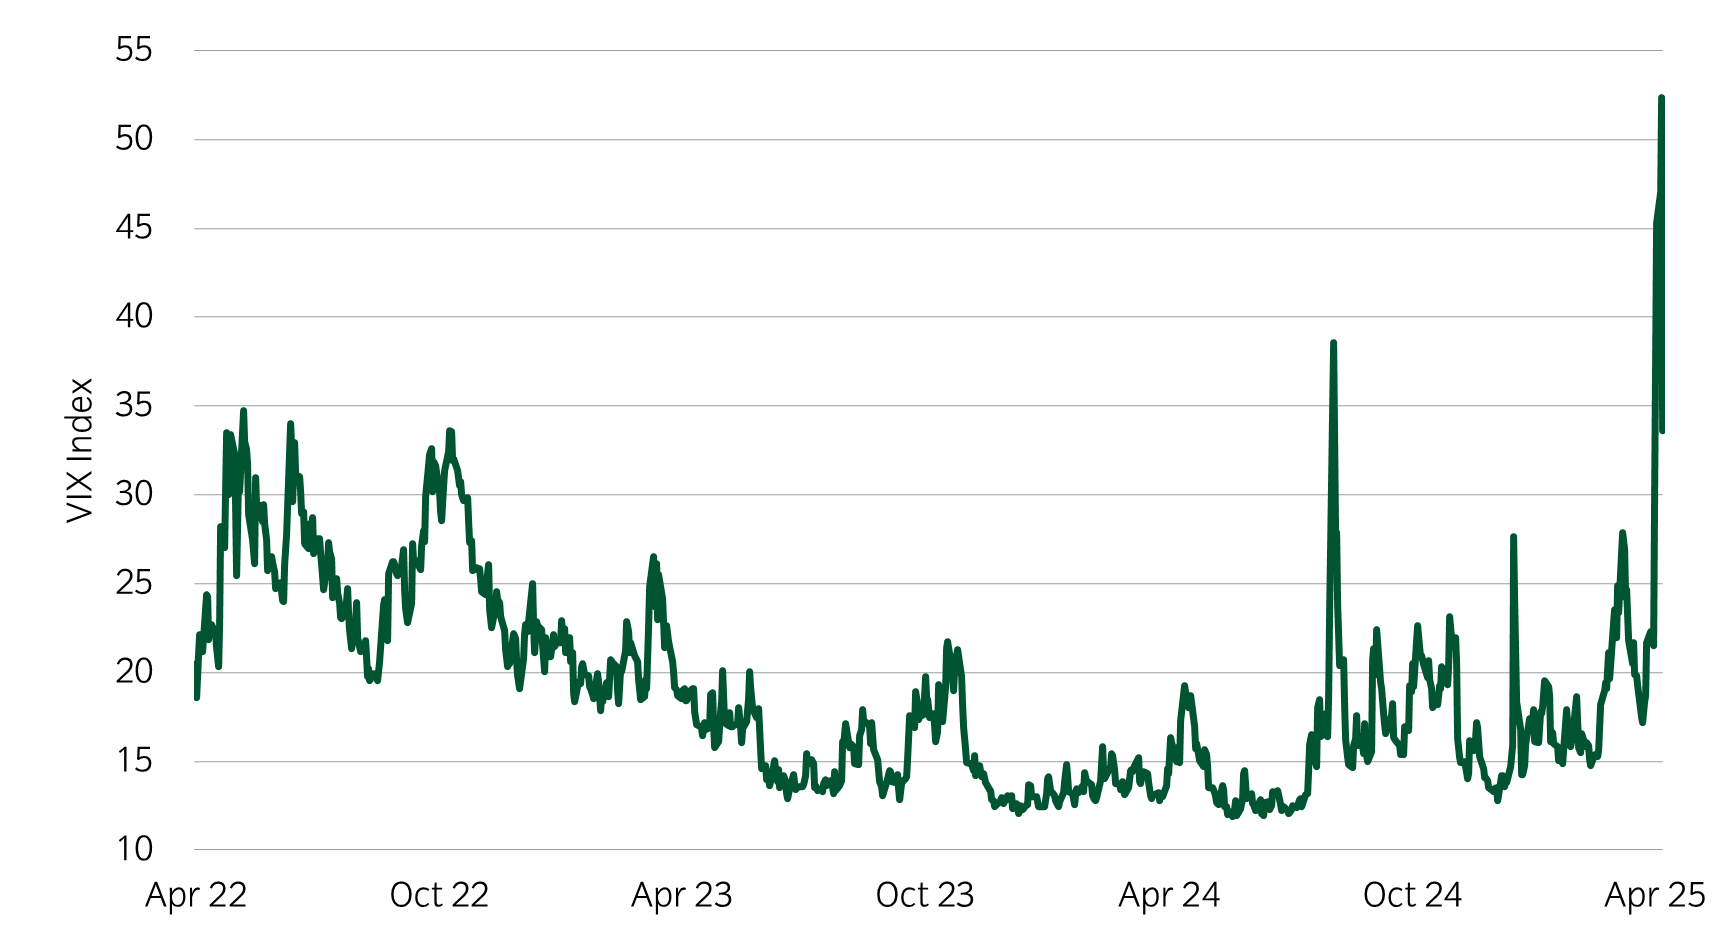
Source: Bloomberg and Insight Investment as at 10 April 2025.
- Volatility returned to the markets with a vengeance over the week, as President Trump announced tariffs against global trading partners on 2 April and most assets subsequently experienced sharp moves.
- The Trump tariffs are an aggressive opening stance in the evolving global trade war. Accordingly, markets are pricing in continued policy uncertainty and an increased risk of recession.
- Over the week, most global equity markets suffered a drawdown more than three standard deviations from an average weekly move, while one day equity moves even exceeded seven standard deviations from an average daily move.
Significant market moves this week
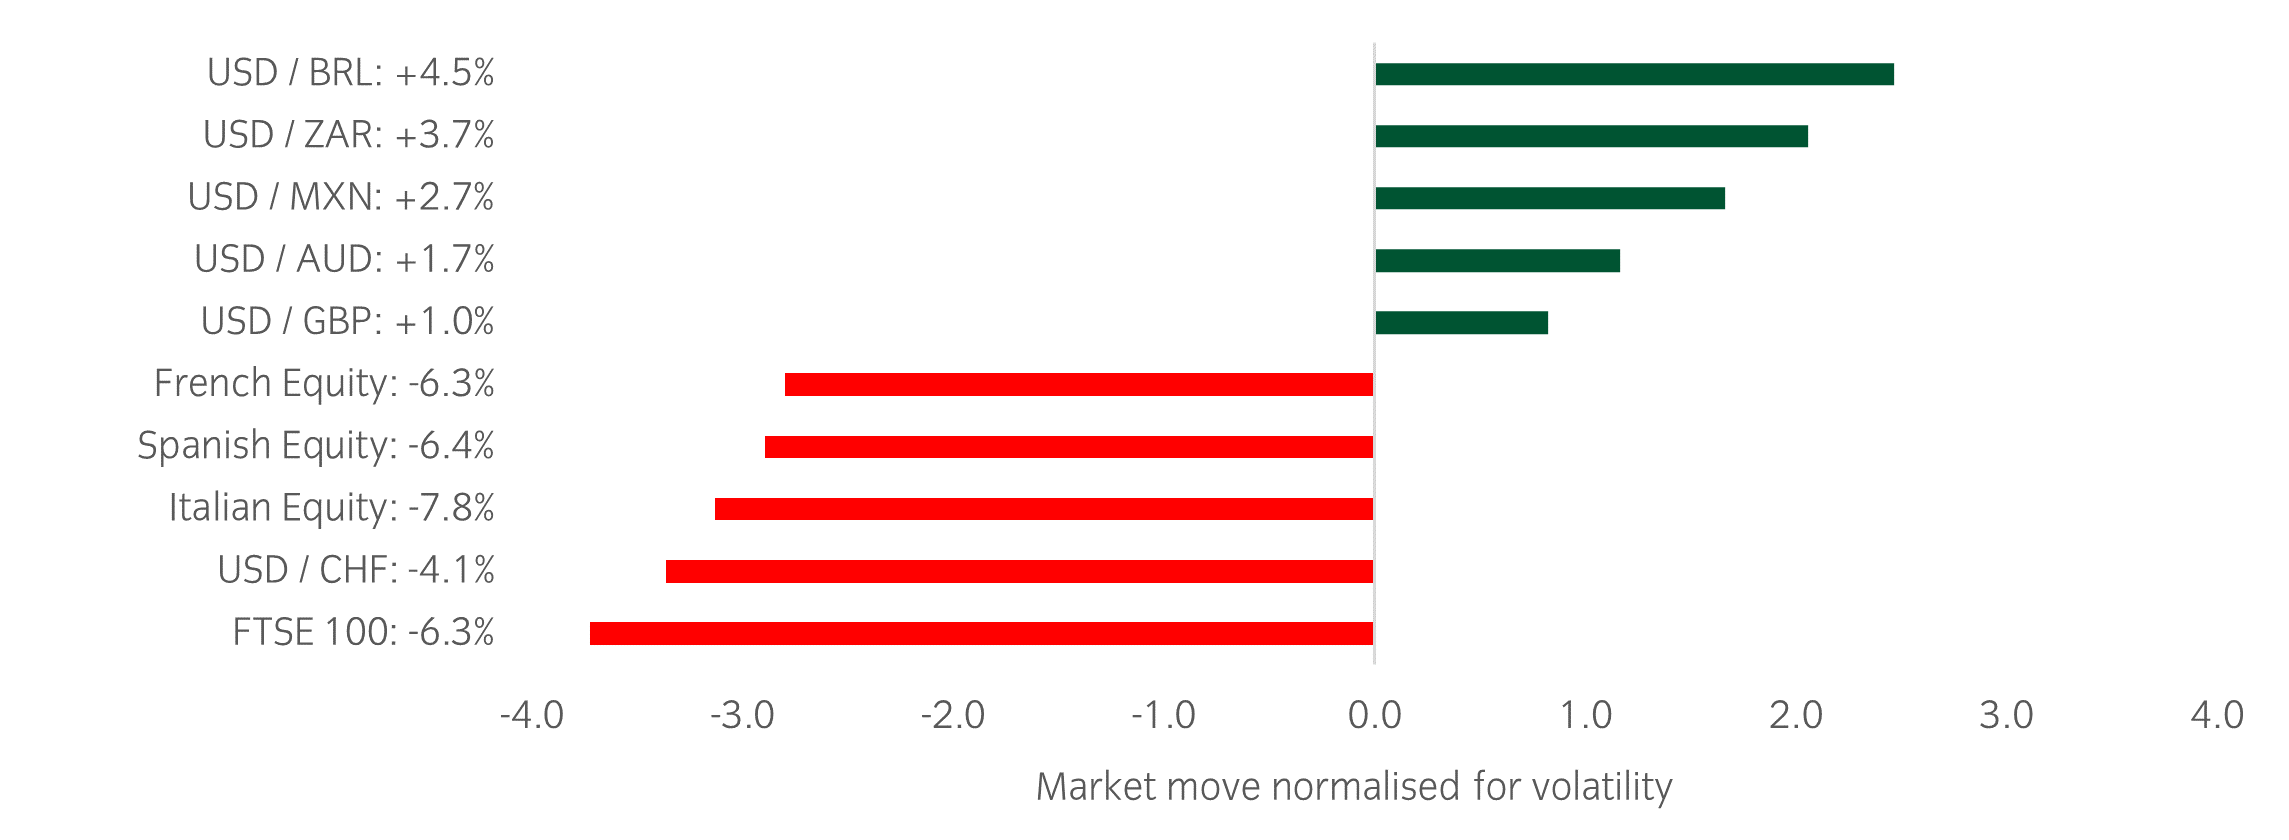
Source: Bloomberg and Insight as at 10 April 2025. The price movement of each asset is shown next to its name. The data used by the bar chart divides the price movement by the annualised historical volatility of each asset.
Winners & losers: The US dollar fared well against some EM and DM currencies while UK and European equities suffered some of the largest negative risk-adjusted moves.
Over the past week, several things caught our eye:
- The market is continuing to digest President Trump’s tariffs against global trading partners announced on 2 April and then subsequently digesting the 90-day postponement of the tariffs announced on 9 April. The market experienced sharp drawdowns at the start of the week, as it began to price in higher recession risk and greater policy uncertainty. Some of the drawdown was reversed on 9 April but volatility remains high.
- The 90-day postponement does not include China, which had retaliated with its own tariffs against the US. This escalates the trade war between the world’s two largest economies and keeps uncertainty elevated. China’s economy is highly reliant on its exports to the US and the US could face a sharp upward inflation shock as the prices of its consumer goods increase.
- The US is accelerating its trade negotiations with Japan and Korea, potentially in attempts to keep its regional allies in Asia from partnering more closely with China.
- The US 10-year yield has increased over the week while the US dollar declined against other developed market FX. Neither US treasuries nor the US dollar has been a clear diversifier from equities.
Asset allocation observation
Divergence amongst government bond yields
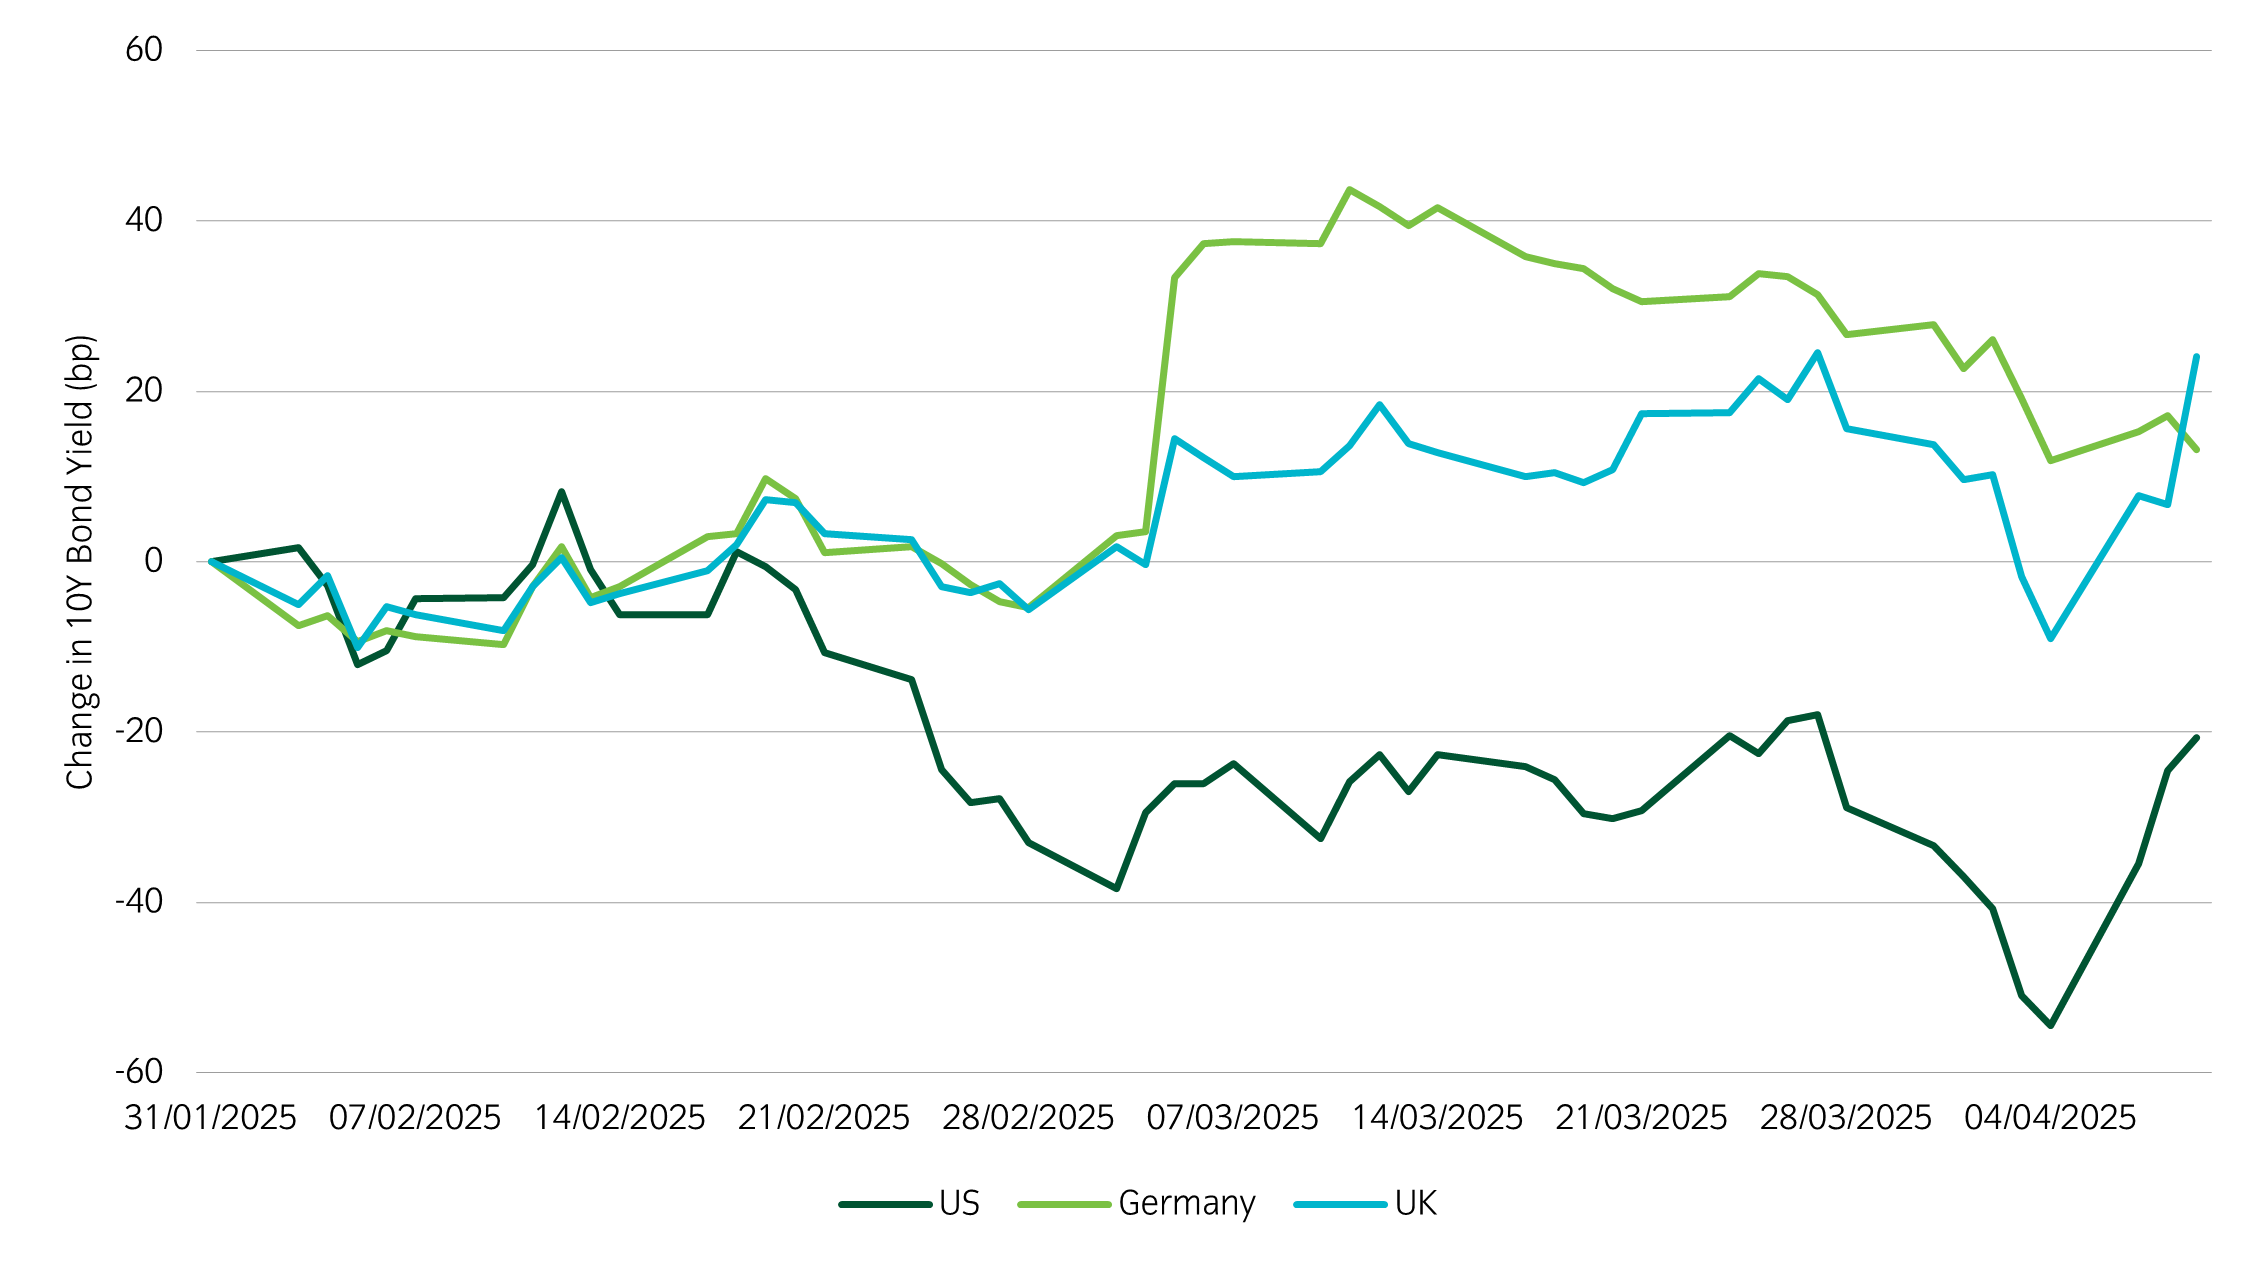
Source: Insight and Bloomberg as at 10 April 2025.
- Over the week, developed market bond yields have not moved together. Over a long history, bond yields tend to fall simultaneously during a market selloff as investors rush toward perceived safer assets. During the recent selloff, however, we saw divergence between US and German bond yields.
- The US 10-year Treasury yield increased over the week while the German 10 year bund yield declined. Investors may be reassessing US treasuries as a safe haven given the high level of policy and economic uncertainty in the US.
- Within our portfolios we have increased duration exposure amidst the uncertain macro backdrop but need to be wary of potentially diverging bond yield reactions as the trade war evolves.
Week to 04 April 2025
Chart of the week
New tariffs confirm President Trump’s protectionist agenda

Source: Bloomberg and Insight Investment as at 03 April 2025.
- President Trump’s new tariffs against global trade partners announced on 2 April have seen assets continue to follow the trends seen since his inauguration.
- Being positioned long US dollars and long US technology stocks was favourable after President Trump was elected in November 2024. However, this trend reversed after President Trump’s inauguration when markets started to price in the possibility that President Trump would prioritise protectionism over growth, at least in the near-term.
- US equities, especially in the technology sector, have continued their downtrend. The US dollar has weakened, and emerging market currencies including the Mexican peso have strengthened.
- The tariff announcements confirm President Trump’s aggressive protectionist agenda and his drive to balance the US trade deficit and resuscitate the US manufacturing industry. This agenda may come at the expense of growth and spur inflation globally. Markets are pricing in an increased probability of recession in the US.
Significant market moves this week

Source: Bloomberg and Insight as at 03 April 2025. The price movement of each asset is shown next to its name. The data used by the bar chart divides the price movement by the annualised historical volatility of each asset.
Winners & losers: US and UK government bonds had large positive risk-adjusted moves while Japanese, US, and European equities faced large drawdowns.
Over the past week, several things caught our eye:
- President Trump announced tariffs against US trade partners on 2 April. No region or specific sector was spared, although the exact percentage varied depending on the country. The minimum baseline tariff was 10% but this went up as high as 49% for some Asian countries that have large export volumes to the US.
- The Office of the US Trade Representative gave details of how the tariff percentages were calculated: “Reciprocal tariffs are calculated as the tariff rate necessary to balance bilateral trade deficits between the US and each of our trading partners.” Thus, countries with relatively low trade deficits with the US (e.g. the UK) received a 10% tariff rate while countries with high trade deficits (e.g. China) received higher tariff rates.
- Economists are forecasting a reduction in growth in the US and globally as a result of the tariffs. Inflation is also expected to increase, and global trade levels are expected to decline.
- The final US effective tariff rate has increased from 2.5% to an estimated 24%, a level not seen since before World War I. This was ultimately a more aggressive stance than the market had expected, and thus global equities fell sharply following the announcement. US Treasury 10-year yields fell 18bp as markets priced in a higher probability of a growth shock and recession in the US due to the tariffs. The US dollar also weakened, continuing the downtrend in the currency seen since President Trump’s inauguration in January.
- President Trump seemed to suggest that the tariff rates could be negotiated, so some uncertainty remains and markets will price in more details in the coming weeks and months. However, even with room for negotiation for the exact tariff rates, President Trump has fired an aggressive opening shot in the global trade war and started a historic shift in trade relations and global alliances.
Asset allocation observation
Shifts in correlations for USD and 10- Years Treasuries

Source: Insight and Bloomberg as at 03 April 2025.
- In recent years, the US dollar had a negative correlation to US equities on average and had tended to appreciate during a market selloff. Currently, however, this relationship has flipped as US policy uncertainty has increased and the US growth backdrop has started to weaken.
- In a similar vein, US Treasuries have not acted as a diversifier to US equities in recent years. They have had a low positive correlation to US equities as US bond yields have risen along with US equity markets. In recent months, however, especially since President Trump’s inauguration, this relationship has changed as the US growth and policy trajectory has gotten more uncertain. US Treasuries have rallied strongly since President Trump’s tariff announcements while equities have had negative performance.
- Within our portfolios we have long US dollar exposure which should be dynamically reduced as the currency weakens. We have recently added to duration exposure given the weakening macro backdrop and the reassertion of bonds as a diversifier to risk assets.
Most read
Global macro, Currency

June 2023
Global Macro Research: 30 years in currency markets
Global macro

January 2022
Global Macro Research: Asset allocation, growth and inflation cycles
Global macro, Fixed income

October 2023
Global Macro Research: Yield-curve inversion – an unreliable recession signal?
Responsible investment, Multi-asset, Fixed income, Solutions

November 2024