 United States


Table of contents
- Extracting value from emerging market local currency debt
- The case for emerging market local currency debt
- The major challenge in EMLC is managing event risk
- A term premium-based analysis for navigating event risks in EM
- Applying the term premium approach to the last three crises
- Russia's invasion of Ukraine in 2022
- Turkey's currency and debt crisis in 2018
- Russia's 2014 currency and debt crisis
Extracting value from emerging market local currency debt
Emerging market (EM) debt was one of our key asset class picks at the start of 2022. The dramatic repricing since Russia’s alarming invasion of Ukraine has many considering the potentially attractive risk premium available, particularly in the (often overlooked) area of local currency debt (EMLC).
Importantly, reliably earning the full premium is challenging, due to relatively frequent event risks1, such as war, currency crises and political developments.
However, we believe our “term premium” approach, designed to provide clear red flags regarding developing event risks, can help investors manage and sidestep these event risks.
The case for emerging market local currency debt
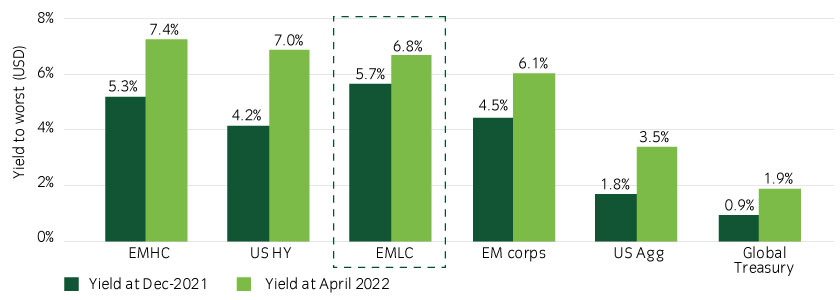
EMLC currently offers comparable yields to hard currency emerging market debt (EMHC) and US high yield (Figure 1).
Figure 1: EM local currency yields stand out in the fixed income universe2
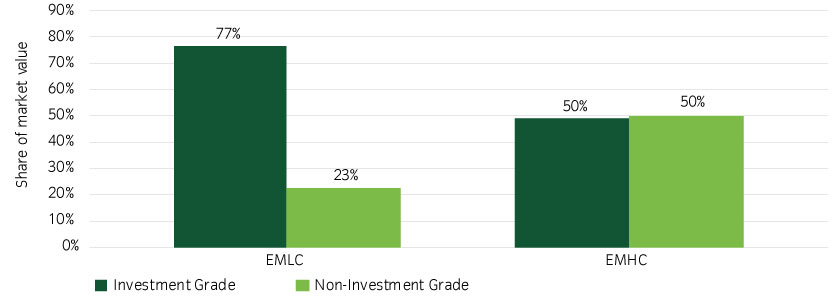
These yields are currently available even though the EMLC market has superior credit quality than its hard currency counterpart, with close to 80% of the market rated investment grade, versus half for EMHC (Figure 2).
Figure 2: The EMLC market has significantly higher credit quality3
EMLC is also a larger and deeper market, offering greater breadth of opportunity, with a market value close to $4trn – larger than the US high yield and EMHC markets combined at ~$2.5trn (Figure 3).
Figure 3: The EMLC market is three times larger than the EMHC market4

EMLC also offers additional diversification against a US investor’s core holdings, as the market has a lower correlation with US high yield and US Aggregate than either EMHC or EM corporates (Table 1).
Table 1: EMLC offers greater diversification for US investors5
| Correlations | EMLC | EMHC | EM Corps |
|---|---|---|---|
| US high yield | 0.70 | 0.79 | 0.85 |
| US Agg | 0.31 | 0.52 | 0.45 |
The major challenge in EMLC is managing event risk
Beyond the human cost, Russia’s invasion of Ukraine in 2022 reminds us that political risks can be severe for EM investors. To reliably capture the risk premium in EM, investors need to able to navigate regional event risks.
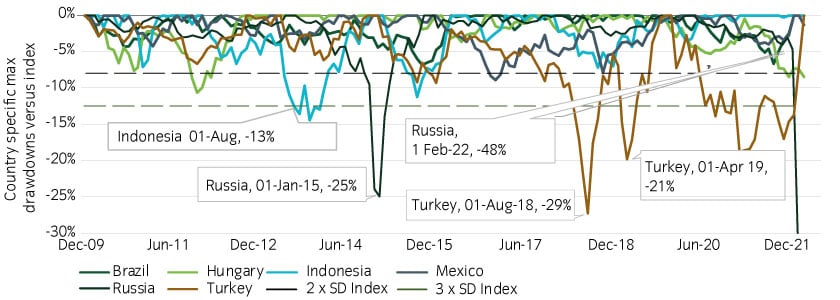
Over the past 12 years, EMLC has seen multiple instances of three-standard deviation, country-specific drawdowns. Each of these related to factors such as war or political developments and led to currency and debt crises (Figure 4).
Figure 4: Event risks have created severe EM country drawdowns6
A term premium-based analysis for navigating event risks in EM
Events such as the Russia invasion of Ukraine are impossible to reliably model or predict. However, we believe that investors can potentially make use of “red flags” indicative of heightened risk and a signal to remove exposure. Our quantitative research suggests that a term premium-based analysis (we define term premium as a bond’s spread over cash rates) can help investors generate these red flags.
Our review of previous incidences of rare events reveals a common three-stage pattern:
- Currency sell-off and the yield curve flattening or inversion
- Term premium falls or turns negative
- Sovereign substantially underperforms EMLC index
As such, we believe that investors could potentially avoid these event risks by employing a systematic strategy designed to monitor local currency sovereigns for changes in term premium.
Applying the term premium approach to the last three crises
Russia's invasion of Ukraine in 2022
Background: After amassing troops near the border of Ukraine from November 2021 (in response to deepening ties between the Ukraine and Western NATO allies), Russia invaded Ukraine on February 24, 2022.
In response, the West implemented many sanctions against Russia, and the Kremlin became increasingly isolated politically.
The Russian ruble (RUB) sold off to an all-time low, almost halving in value against the US dollar, forcing Russia to take measures to defend the currency, such as doubling policy rates to 20% and forcing energy exporters to purchase RUB with their revenues. Equity and bond trading was halted, and a sovereign technical default followed in April 2022.
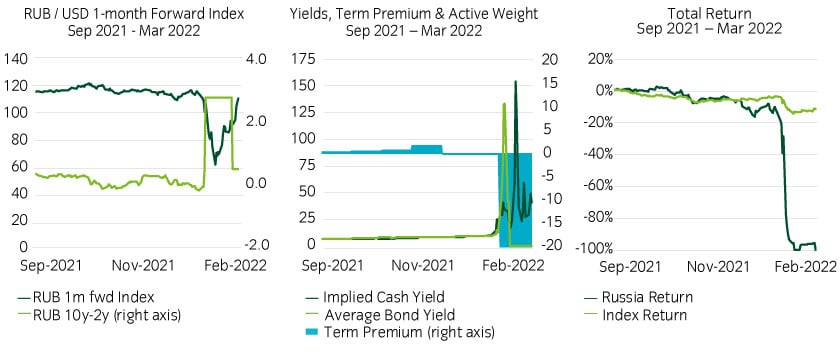
The sequence of events followed the three-stage pattern (Figure 5).
1) Currency sell-off and curve flattening/inversion
- Before the invasion, the Russian ruble sold off from October 2021 through January 2022
- the Russian yield curve inverted between 2 and 10-years, most notably in January 2022
2) Term premium falls or turns negative
- Russian cash yields rose as foreign investors sold in early 2022
- Term premium (blue shaded area) turned negative in early January, presenting a “red flag” for investors, before later collapsing dramatically after the invasion
3) Sovereign underperforms EMLC index
- Russian sovereigns dramatically underperformed following the invasion in February 2022
Figure 5: Russian bonds followed our three-stage pattern7
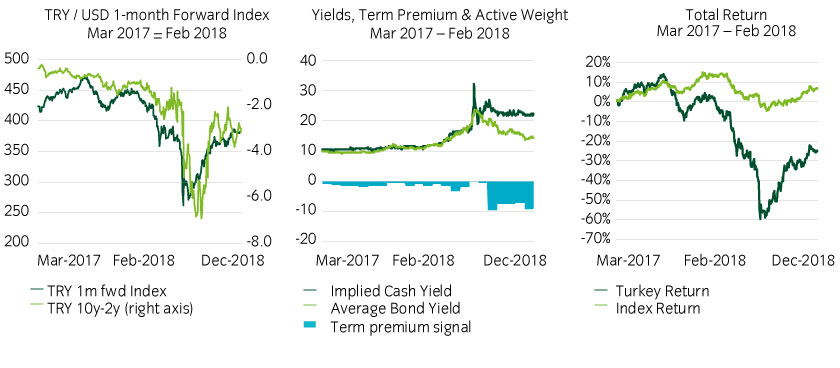
Turkey's currency and debt crisis in 2018
Background: In the run up to 2018, Turkey implemented aggressive fiscal policy stimulus, amassing one of the largest current account deficits in the world. It also relied heavily on capital inflows with banks raising high amounts of foreign currency debt.
However, political instability rose, partly relating to foreign governments’ views on Turkey’s military activity in Syria. A domestic coup attempt against President Recep Tayyip Erdoğan (in apparent response to the President’s socially authoritarian polices) failed, after which the government conducted state seizures of domestic assets.
Foreign investors exited, the Turkish lira (TRY) plunged in value and inflation rose. President Erdoğan blocked the central bank from enacting interest rate hikes, instead forcing it to lower rates further. This caused a cycle of weakening of the TRY (by as much as ~85% in 2018), higher inflation (reaching a 2018 high of 25%), rising borrowing costs, and painfully high defaults, particularly in foreign-currency denominated debt.
1) Currency sell-off and curve flattening/inversion
- The TRY sold off sharply and the yield curve inverted in the third quarter of 2018
2) Term premium falls or turns negative
- The term premium was negative in 2017 and fell further in 2018 as the crisis escalated
3) Sovereign underperforms EMLC index
- Turkish sovereigns dramatically underperformed following the invasion, 10-year Turkish sovereign bonds reaching yields of up to 21% from ~10% pre-crisis
Figure 6: The Turkish crisis in 2018 also followed the three-step pattern8
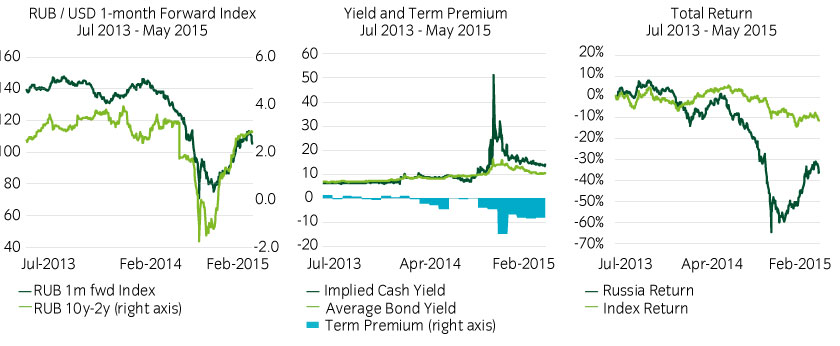
Russia's 2014 currency and debt crisis
Background: Russia faced economic turmoil in 2014 as Crude Oil prices fell 60% in the second half of the year, reducing the value of the sovereign’s key export. Russia’s annexation of Crimea, which occurred earlier in the year, exacerbated the crisis as foreign governments imposed sanctions and foreign investors exited, fearing the possibility of a full-scale war with Ukraine.
The RUB collapsed, with events coming to a head on December 16, 2014 (now known as “Black Tuesday”), in which the US dollar had doubled in value against the RUB from the start of the year.
1) Currency sell-off and curve flattening/inversion
- The RUB sold off in mid-2014
- The curve flattened substantially in 2014 and inverted in 2015
2) Term premium falls or turns negative
- The term premium turned negative in early 2014, ahead of the crisis and collapsed further as the crisis escalated
3) Sovereign underperforms EMLC index
- Russian sovereigns performed poorly in 2014 as the EMLC index traded largely flat
Figure 7: Term premium was also a red flag during Russia’s 2014 crisis9
Conclusion
In our view investors should seriously consider opportunities in EMLC, given the relative high yields, credit quality and depth in a relatively overlooked part of the EM debt market. It will also likely offer additional diversification against an investor’s existing core US fixed income and / or high yield exposure.
However, if they do look to invest, we believe a quantitative approach is worth considering, particularly one able to identify “red flags” for potentially developing rare event risks and act accordingly. We believe our systematic term premium approach to EM local currency debt can aid investors navigating these risks.