


Chart of the week
Government bond yield curves continue to steepen
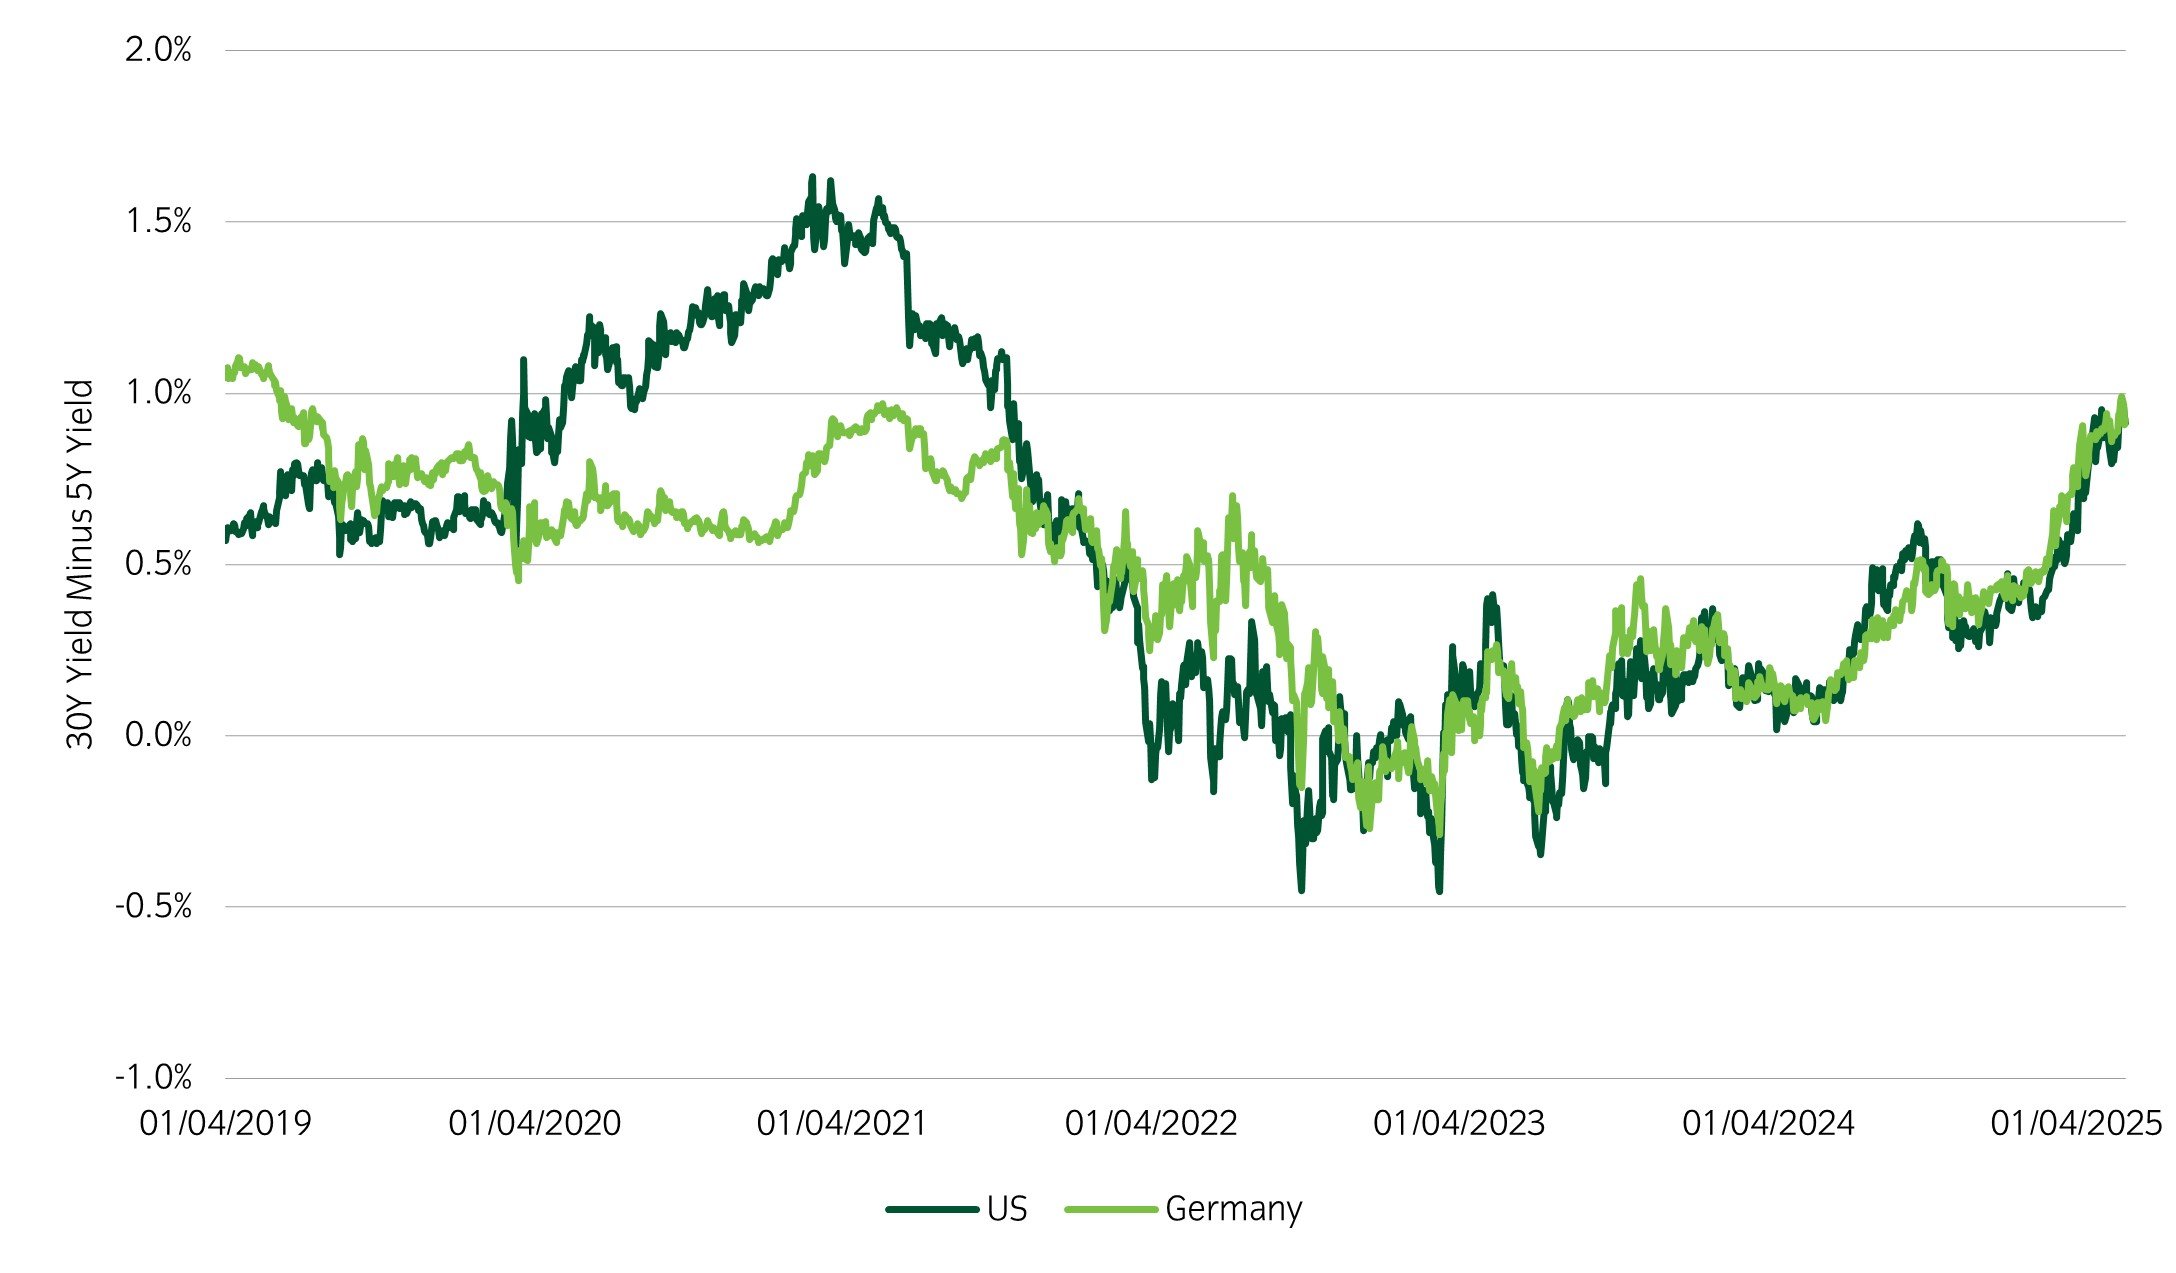
Source: Bloomberg and Insight Investment as at 29 May 2025.
- Amid global policy and economic uncertainty, government bond yield curves have continued steepening.
- The steepening is likely driven in part by concerns around the near-term growth outlook, so investors are pricing in a higher probability of central banks easing policy rates to support growth.
- Another likely driver is marginally increasing fears over the sustainability of US debt as Congress discusses the budget bill, with the likelihood of the fiscal deficit continuing to grow.
- Investors may be wary of holding longer-maturity debt and expecting greater issuance needs to fund the US fiscal deficit.
Significant market moves this week
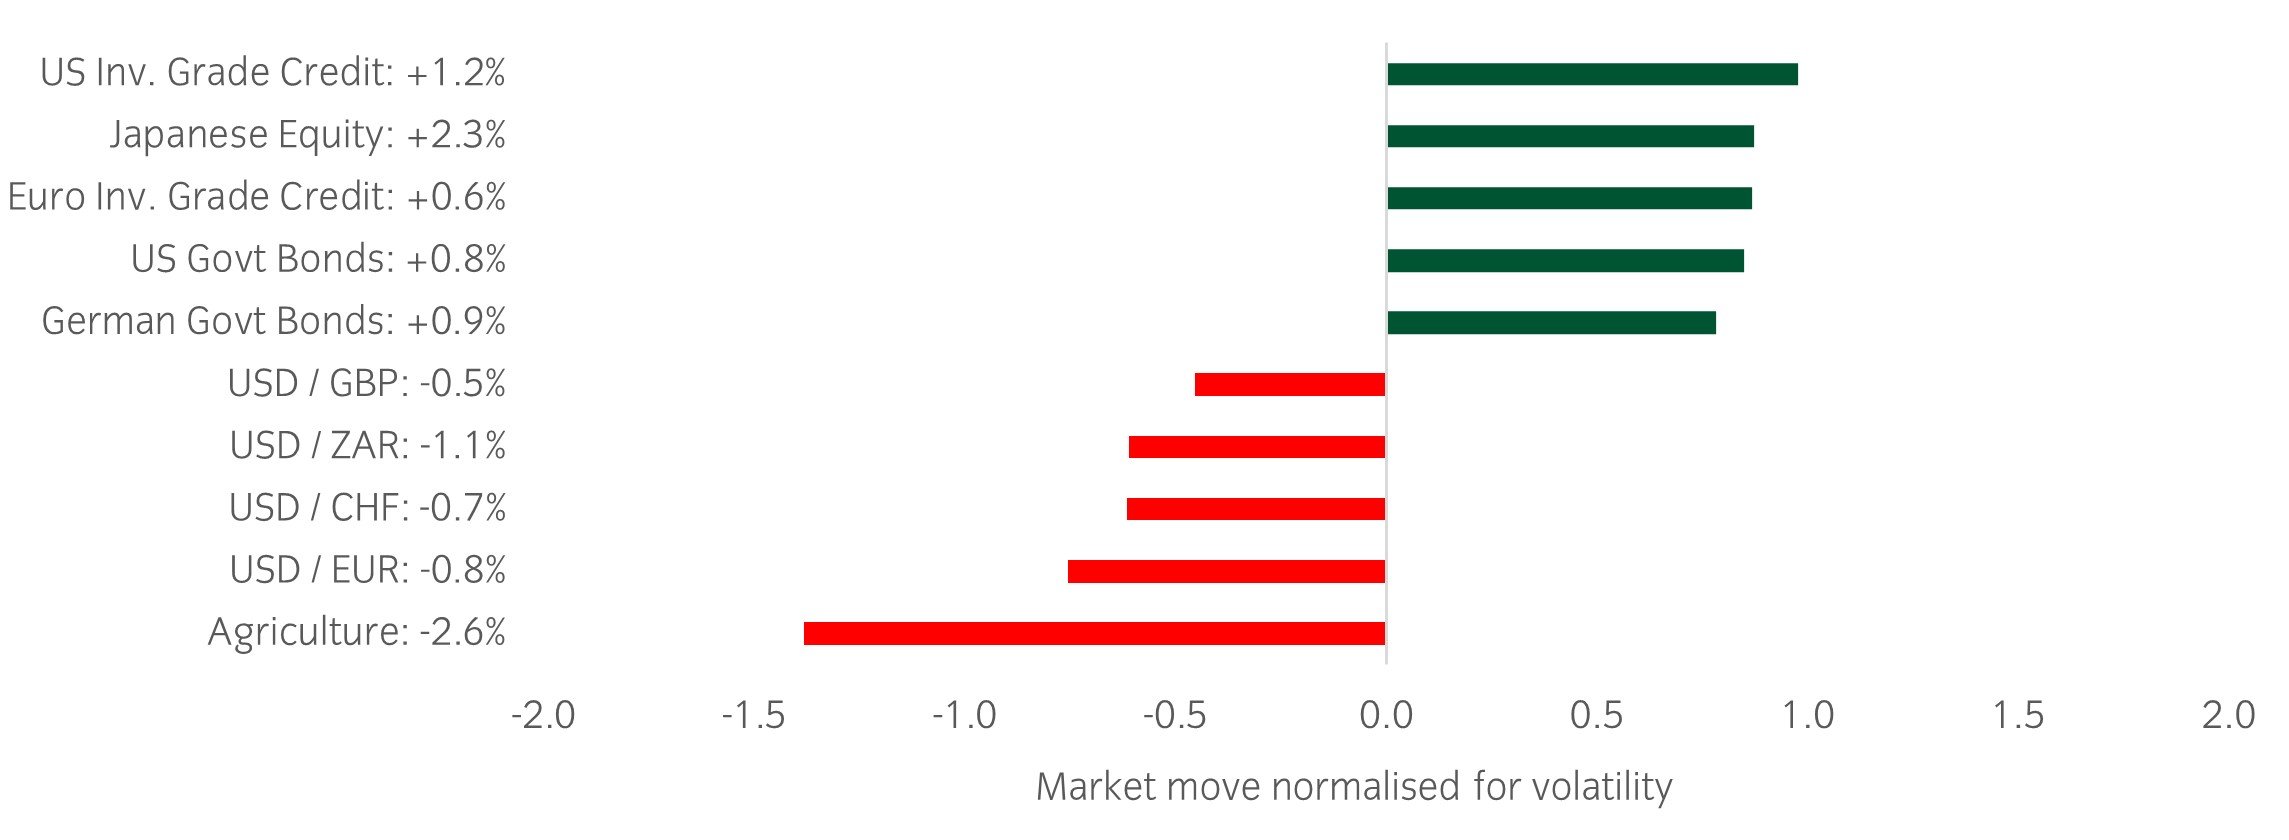
Source: Bloomberg and Insight as at 29 May 2025. The price movement of each asset is shown next to its name. The data used by the bar chart divides the price movement by the annualised historical volatility of each asset.
Winners & losers: US and European investment grade credit had outsized risk-adjusted returns, whereas the US dollar weakened versus developed market peers.
Over the past week, several things caught our eye:
- The US Court of International Trade ruled that President Trump cannot use the International Emergency Economic Powers Act (IEEPA) to impose tariffs. This reverses the “Liberation Day” tariffs and fentanyl-related tariffs on Mexico, Canada, and China.
- Markets initially reacted with a risk-on tone, but the Trump administration is going to appeal the decision and has other tools at its disposal to impose tariffs. Policy uncertainty will remain high, and this development could further delay decision-making by businesses, consumers, and global trade partners.
- After the initial rally following the news, global equities gave up most of their gains and the US dollar ended the day down versus other developed currencies such as the euro and Japanese yen.
- As for US data released during the week, the Conference Board Consumer Confidence Indicator surprised to the upside from low levels not seen since the COVID pandemic.
- The long-end of the Japanese yield curve continues to make headlines as the 30-year yield hovers around 3%, its highest level in more than 20 years.
Asset allocation observation
Equity P/E multiples still in top quartile
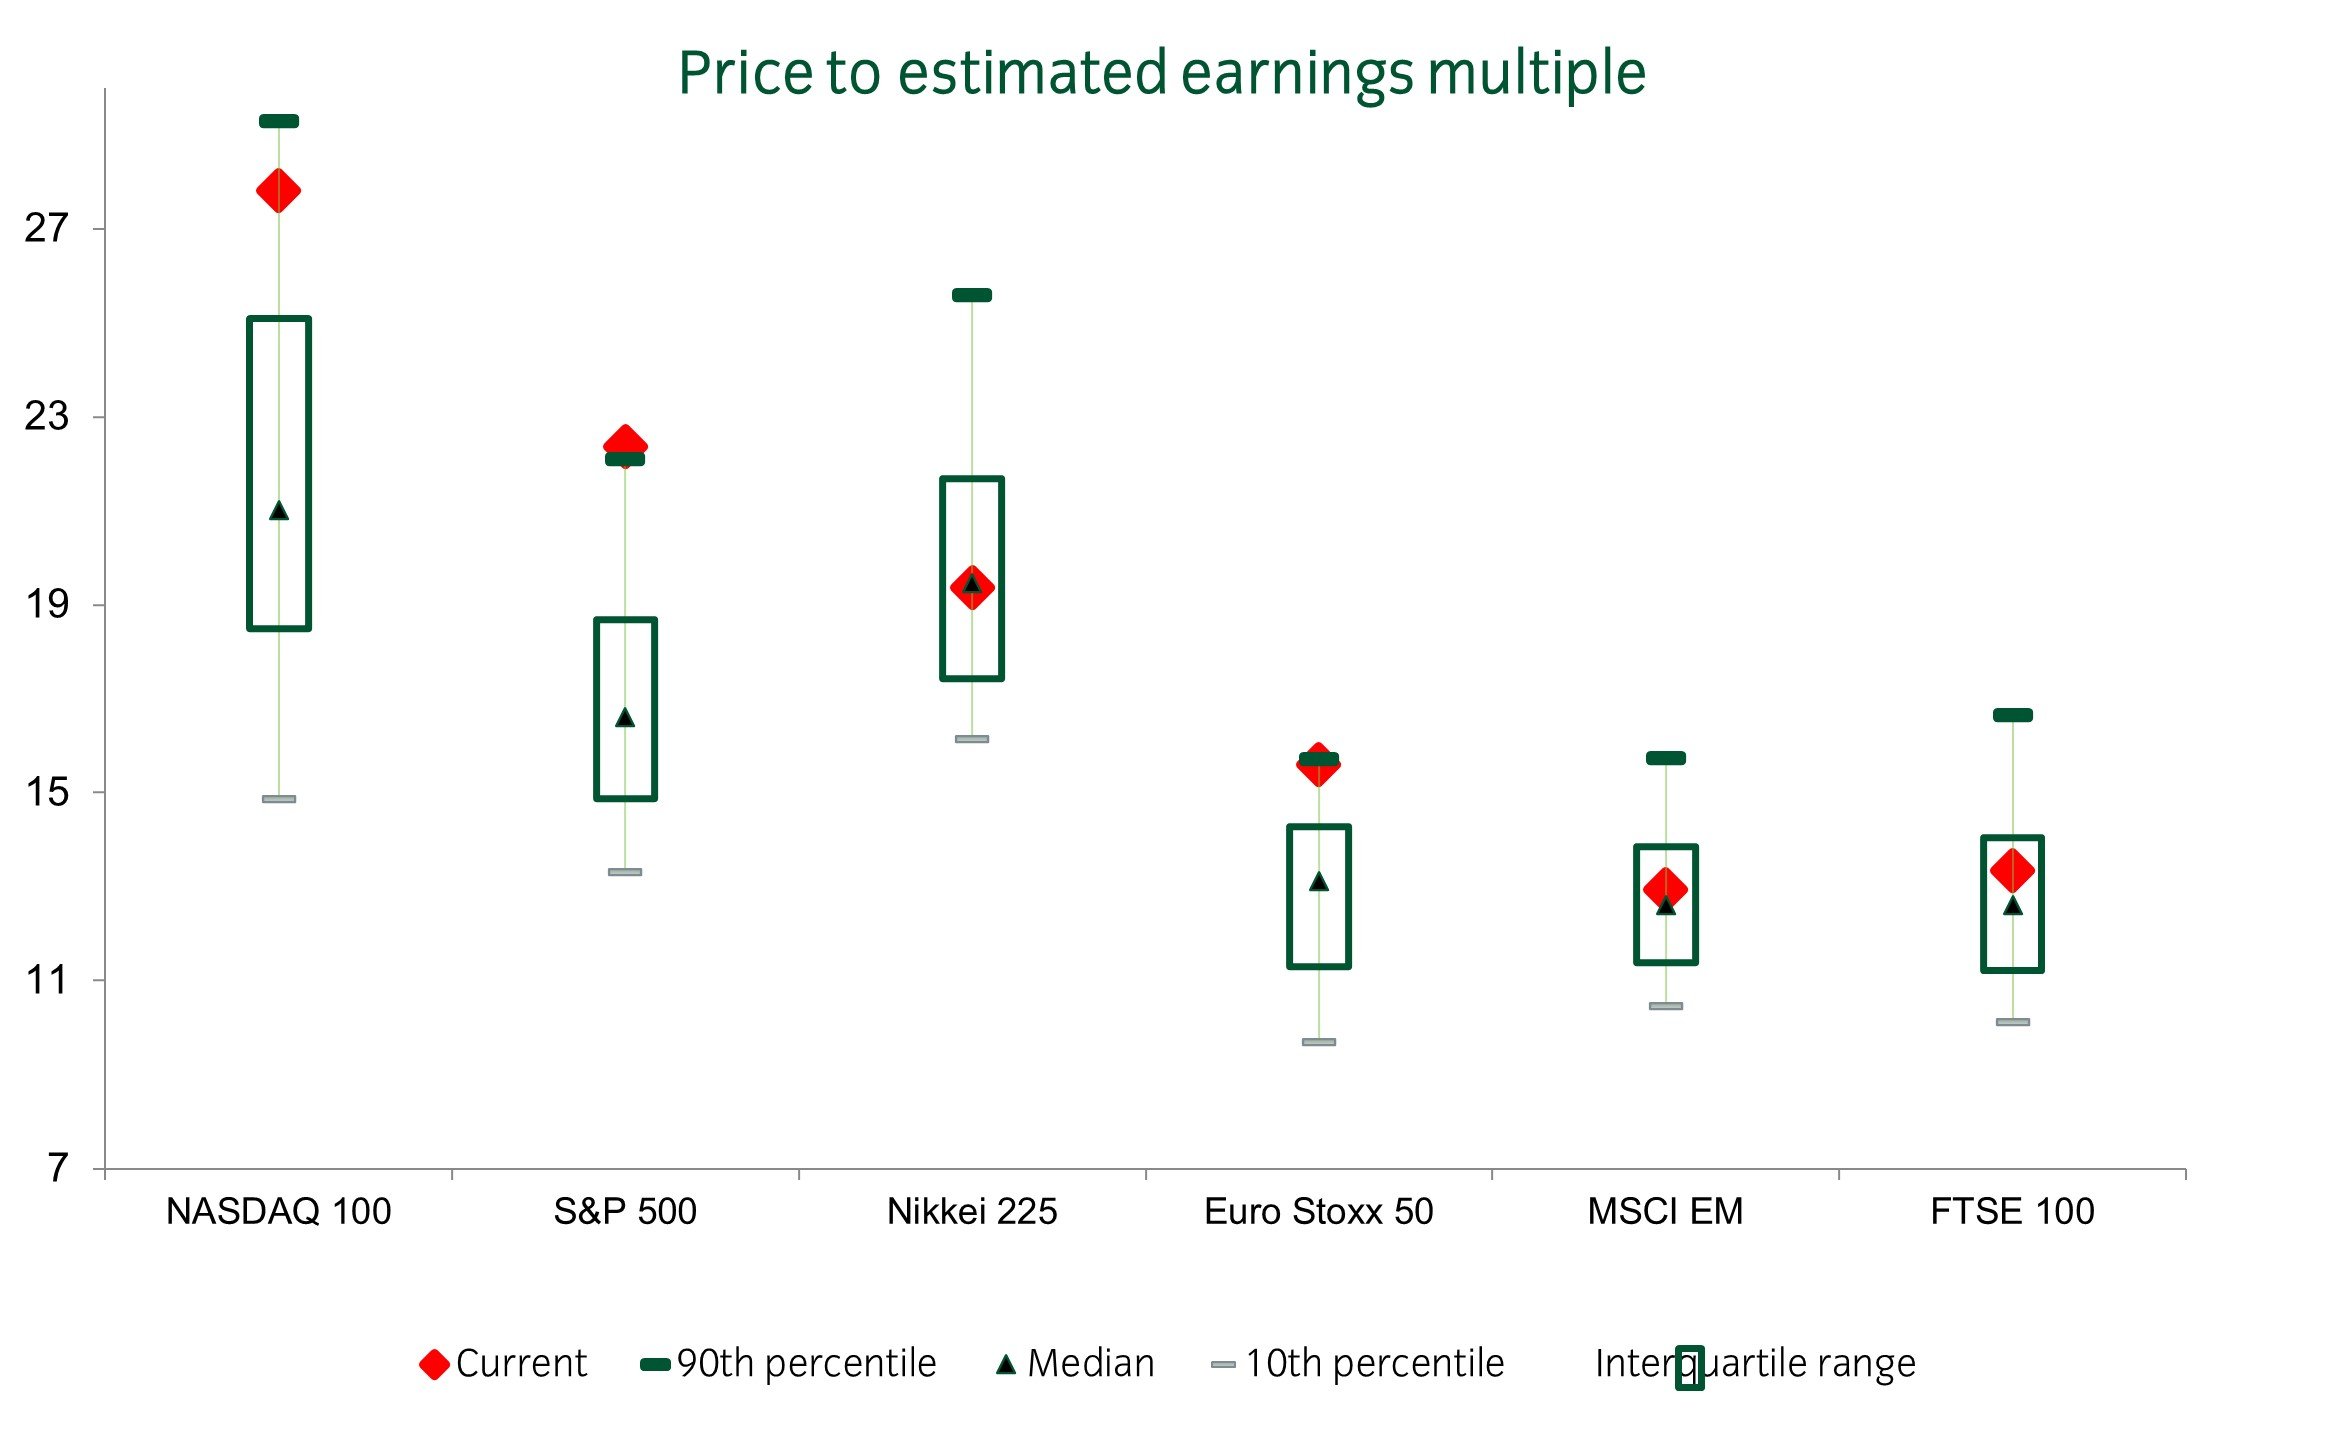
Source: Insight and Bloomberg as at 29 May 2025.
- Price to estimated earnings (P/E) multiples across equity markets are now largely higher than where they were at the end of March 2025. There are various reasons for this. Trump announced a 90 day pause on the trade war with China and other trading partners, and corporates expressed growth concerns but were not overly pessimistic during the recent earnings season. Furthermore, the proposed tax bill is making progress through the two chambers of Congress, making the proposed extensions to tax cuts likely.
- The market is awaiting softness in the hard economic data as the impact of tariffs and uncertainty start to be felt, and final details of the tax bill remain to be seen. In the meantime, equity markets remain buoyed, but the US dollar continues to weaken.
- Within our portfolios, we are relatively lighter on cyclical risk relative to history given the policy uncertainty. We are also looking for limited loss upside structures in markets with lower valuations, such as the UK or emerging markets, to be able to participate if valuations in these markets catch up to the rest of the world.
Chart of the week
US bond yields move close to historical highs
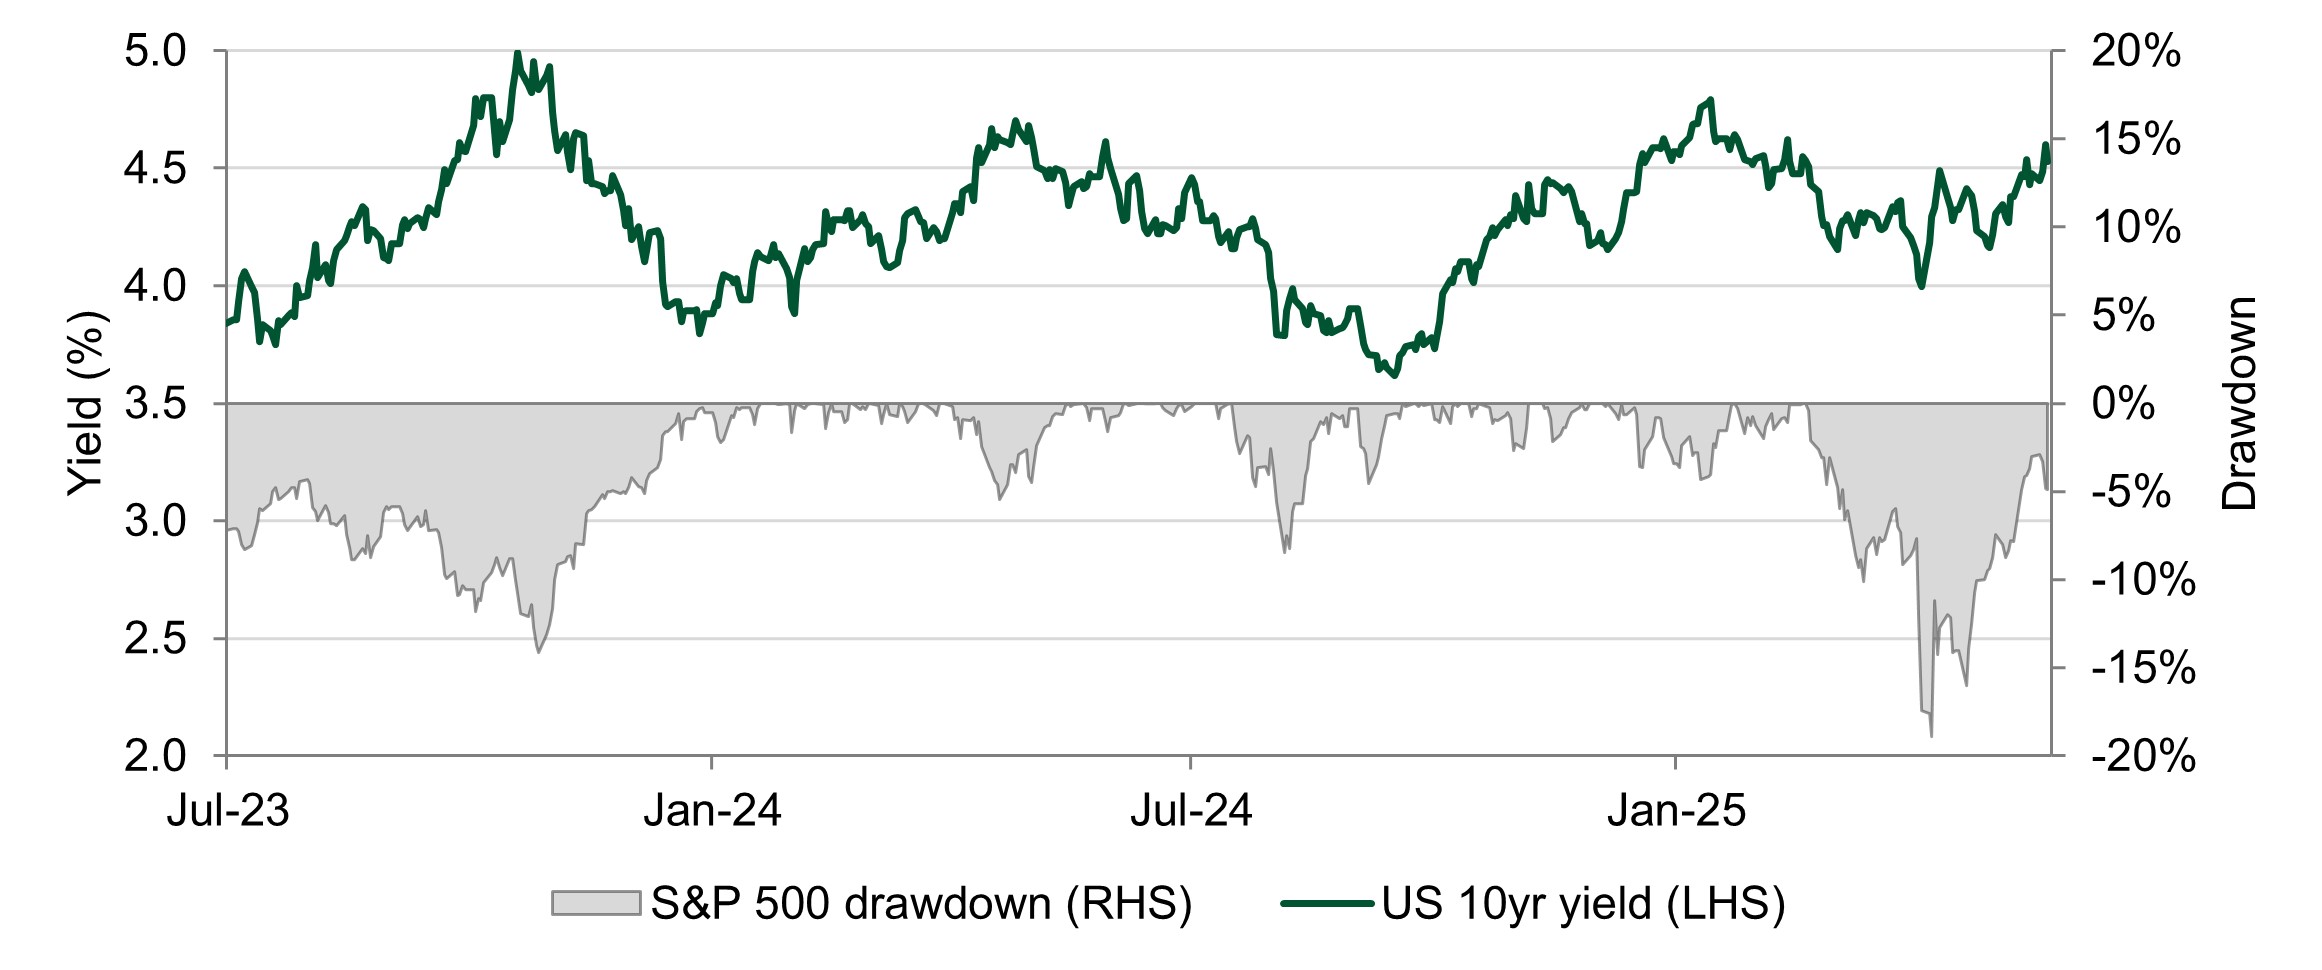
Source: Bloomberg and Insight Investment as at 22 May 2025.
- During the week, the US 10-year yield rose above 4.6%, while the US 30-year yield rose above 5%. The US 10-year yield is nearing recent historical highs, while the US 30-year yield has reached levels not seen since 2023.
- US equities are sensitive to both the level and pace of rising US yields and tend to experience drawdowns when US yields increase very quickly.
- Furthermore, the US growth outlook is uncertain amid the trade war and expected further fiscal expansion. So, a further increase in bond yields will likely be accompanied by a larger drawdown in US equities.
Significant market moves this week
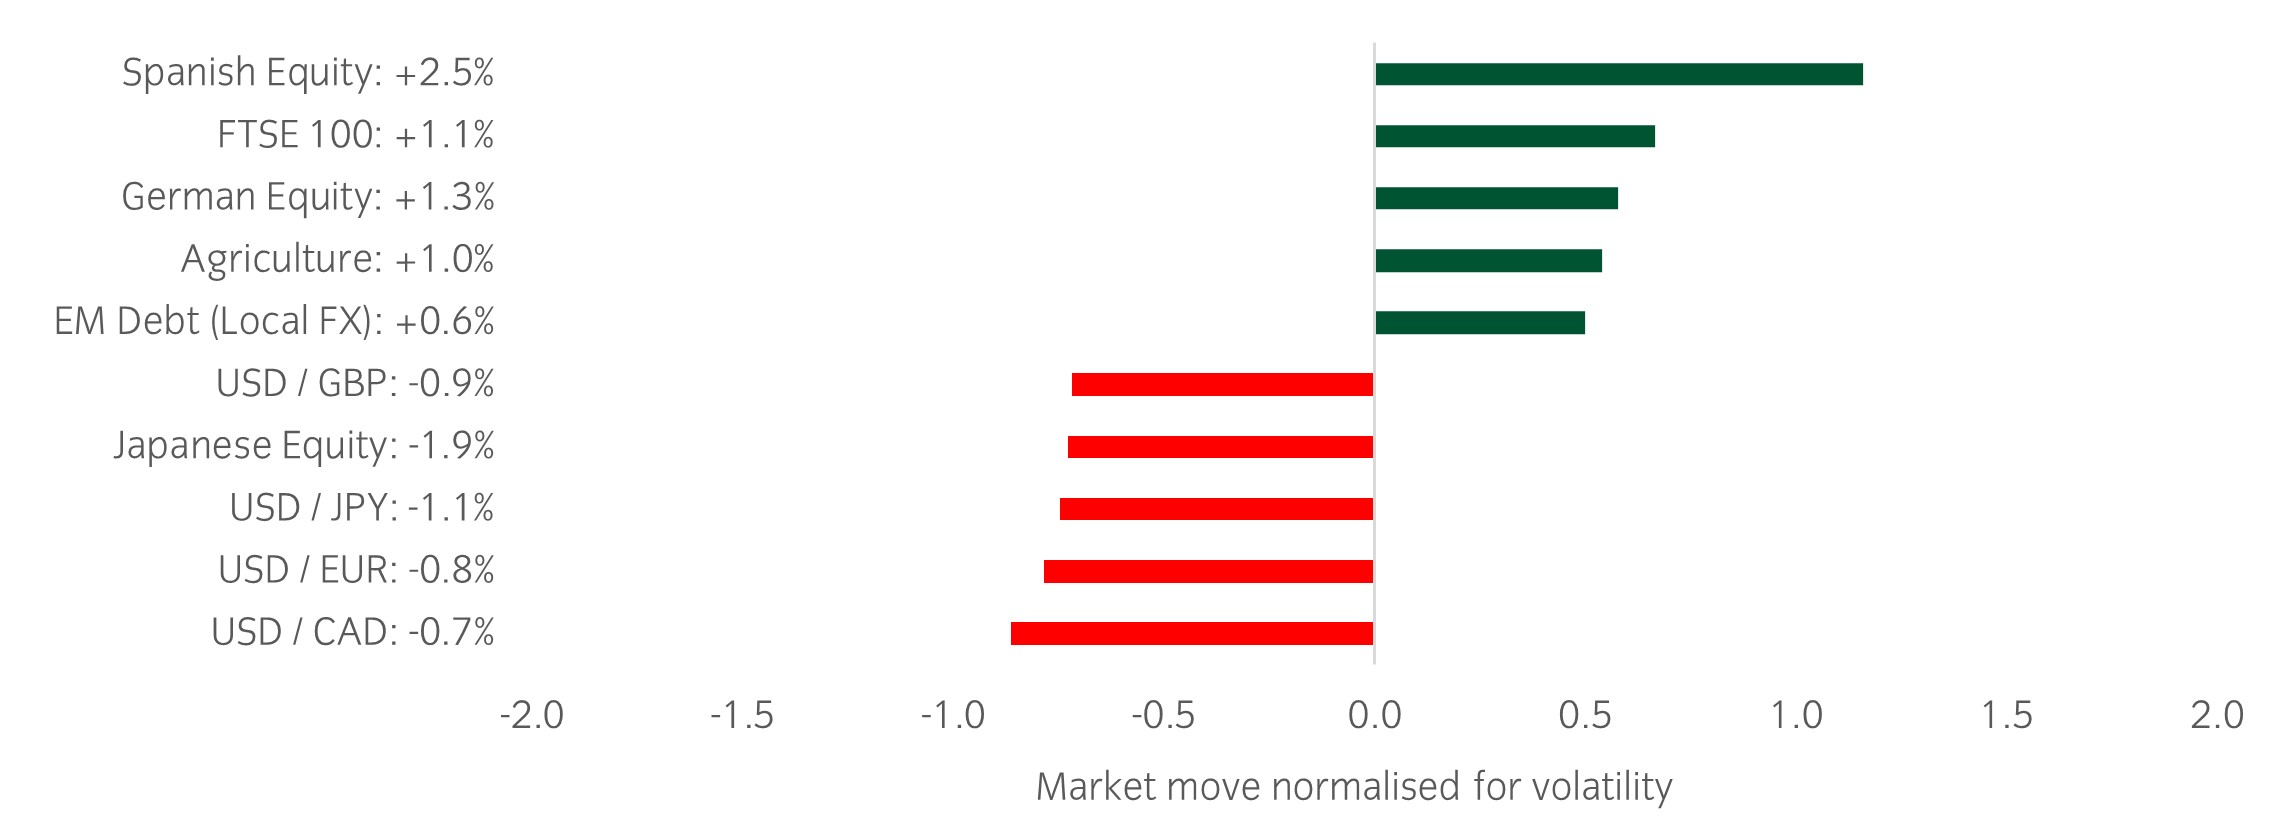
Source: Bloomberg and Insight as at 22 May 2025. The price movement of each asset is shown next to its name. The data used by the bar chart divides the price movement by the annualised historical volatility of each asset.
Winners & losers: European equities had strong risk-adjusted returns this week while the USD weakened against developed market currencies such as the Japanese Yen, the Euro, and the Canadian dollar.
Over the past week, several things caught our eye:
- New details of the budget proposal in the US emerged – the proposal included an extension of existing tax cuts but did not include many new provisions for spending cuts. Initial estimates of the impact from the budget are for a 0.6% boost to growth and little change in the fiscal deficit over the next 10 years.
- The budget bill has passed the US House of Representatives and next needs to be debated within the Senate, so the final details may change in the coming weeks and months.
- The US 30-year yield exceeded 5% as concerns around the fiscal backdrop mounted, as the US already has a fiscal deficit of nearly 7% and seemingly no plans to reduce the deficit. The longer end of the Treasury yield curve increased by a larger amount than the shorter end, as markets again became concerned about growth risks amid large borrowing needs.
- The US dollar continued to weaken against broad developed and emerging market currencies. Over the week, the US dollar weakened even as US Treasuries and US equities found some stability. The divergence between the direction of US Treasury yields and the US dollar has continued.
Asset allocation observation
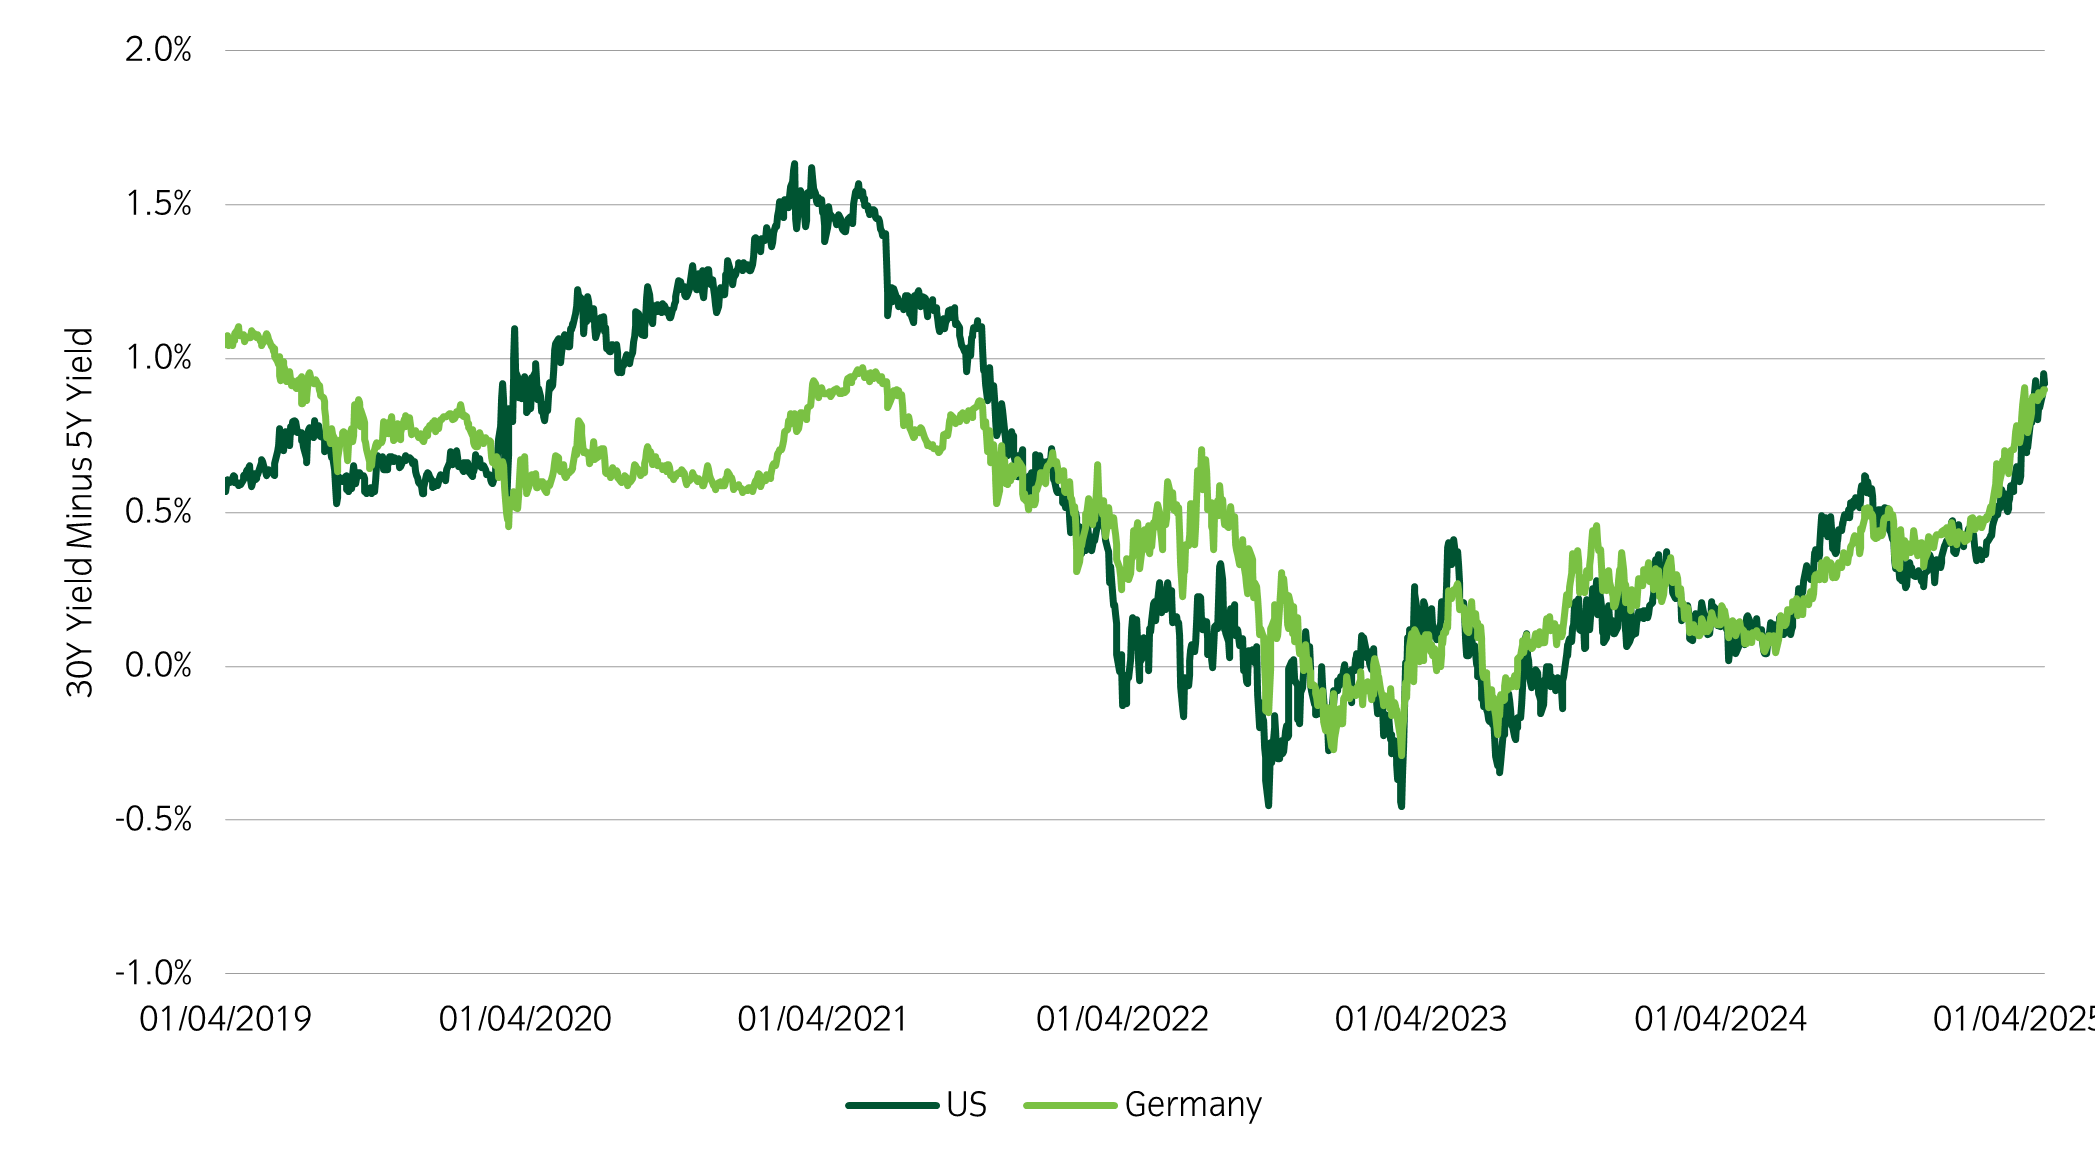
Government bond yields diverge
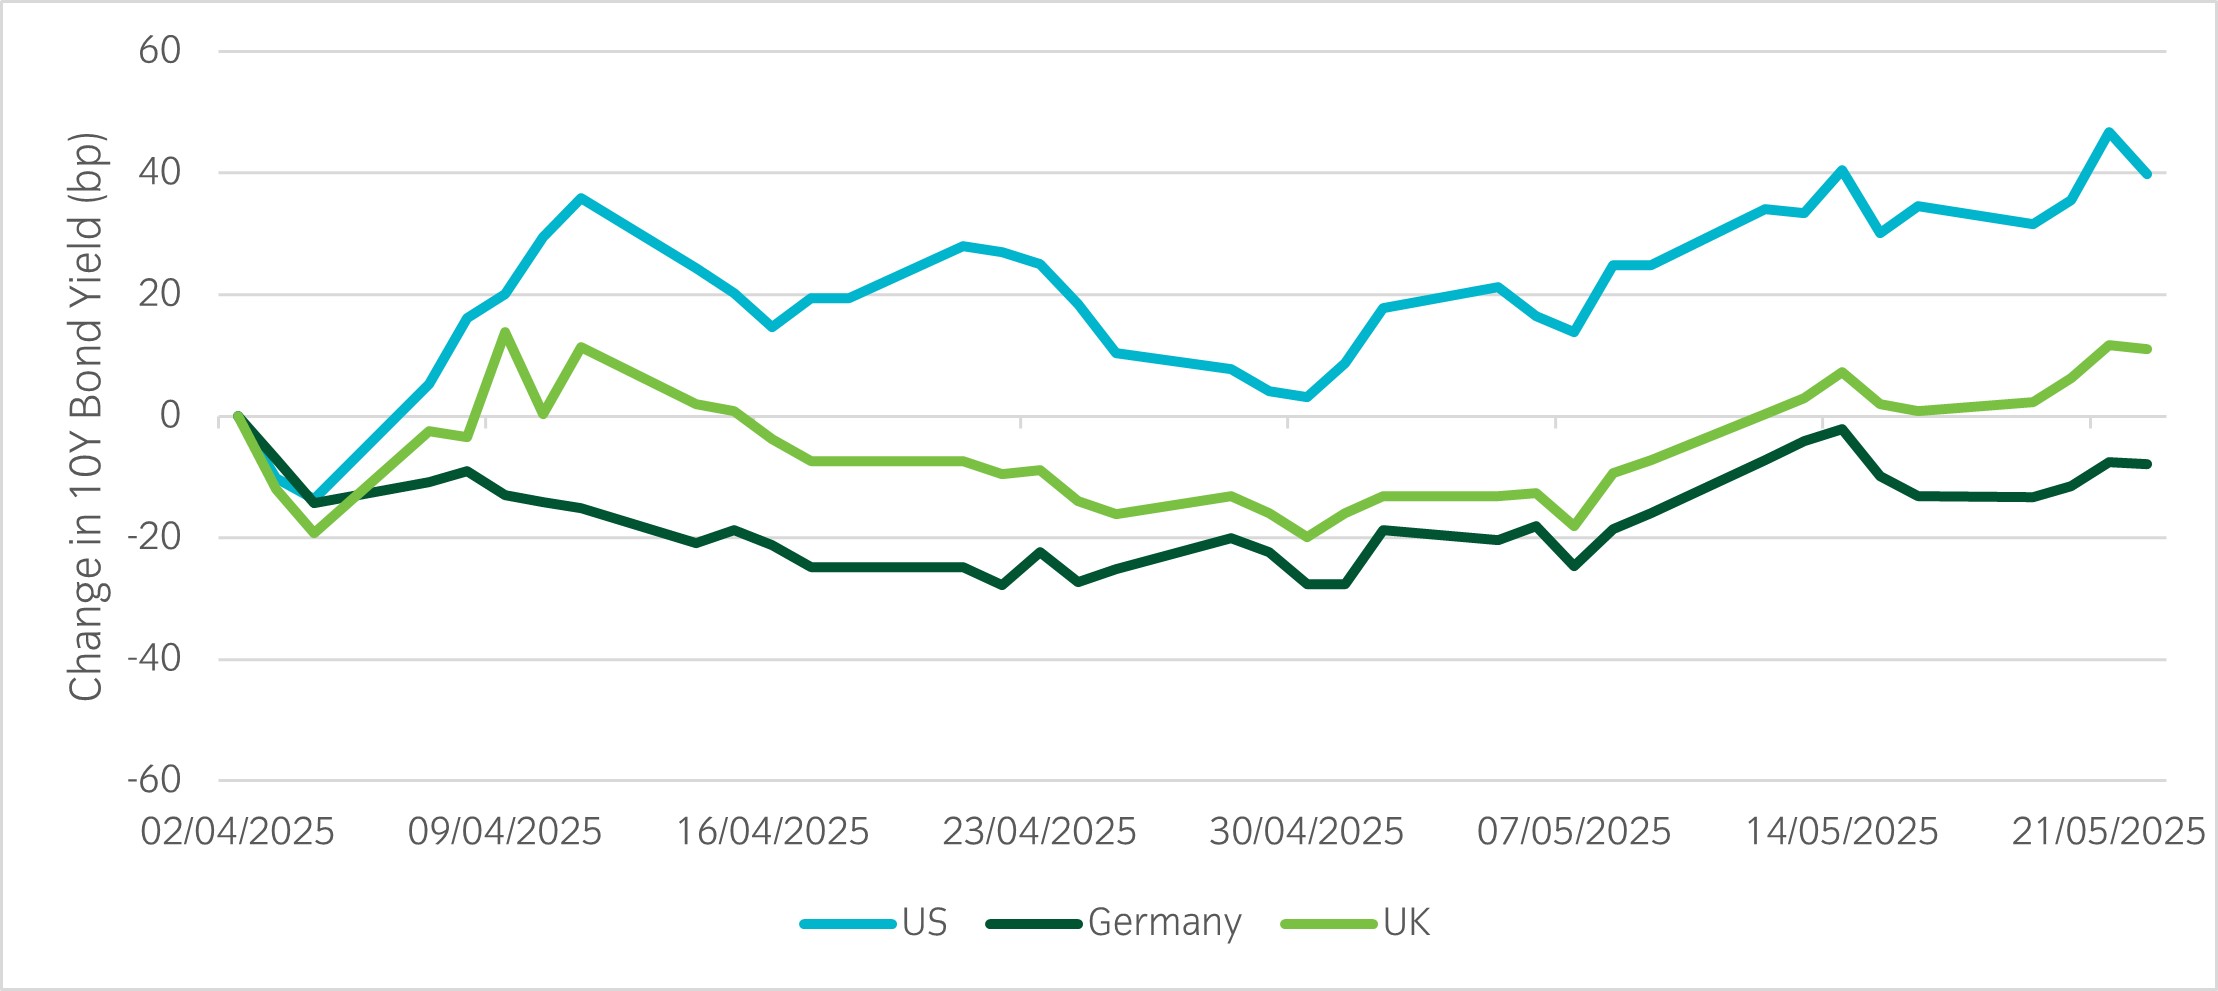
Source: Insight and Bloomberg as at 22 May 2025.
- Since 2 April, developed market bond yields have not moved together. Over a long history, bond yields tend to fall simultaneously during a market selloff as investors rush toward perceived safer assets. During recent months, however, we have seen divergence between US and German bond yields.
- The US 10-year Treasury yield have increased by 40 basis points while the German 10-year bund yield have declined by 8bp since 2 April. Investors may be reassessing US Treasuries as a safe haven given the high level of policy and economic uncertainty in the US. The recent budget negotiations also indicate that the US will likely maintain or expand its already high fiscal deficit.
- Within our portfolios we have increased duration exposure amidst the uncertain macro backdrop but need to be wary of potentially diverging bond yield reactions as the trade war and fiscal considerations evolve.
Chart of the week
"The US dollar strengthens after de-escalation in the US-China trade war"
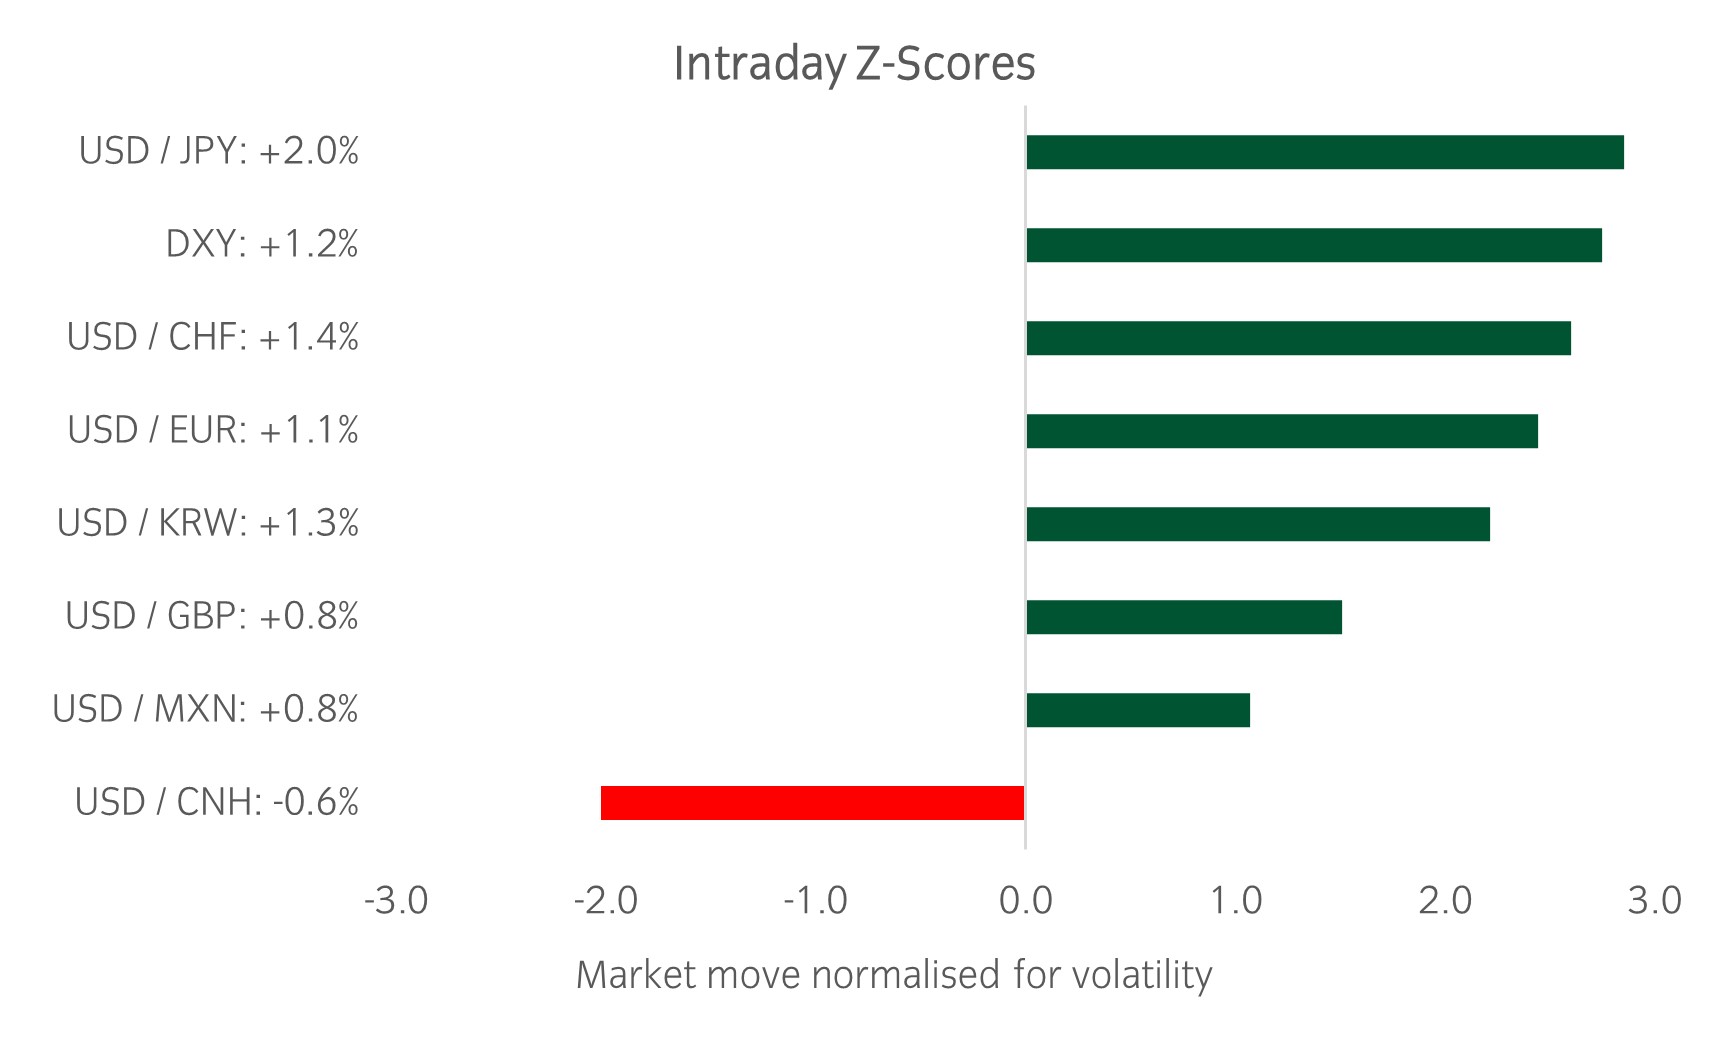
Source: Bloomberg and Insight Investment as at 12 May 2025.
- After a round of talks in Switzerland, the US and China agreed to temporarily lower their respective tariffs for 90 days and to de-escalate the ongoing trade war between the two economies.
- The 90-day pause will provide the two countries time to negotiate a broader trade agreement and represents an upside surprise to the market.
- The improved risk sentiment pushed global equities higher. The US dollar strengthened by almost 3 standard deviations following the announcement, reversing some of the US dollar weakness seen since 2 April. The market moves reverse some of the ‘sell America’ narrative that had gained traction in recent weeks.
Significant market moves this week
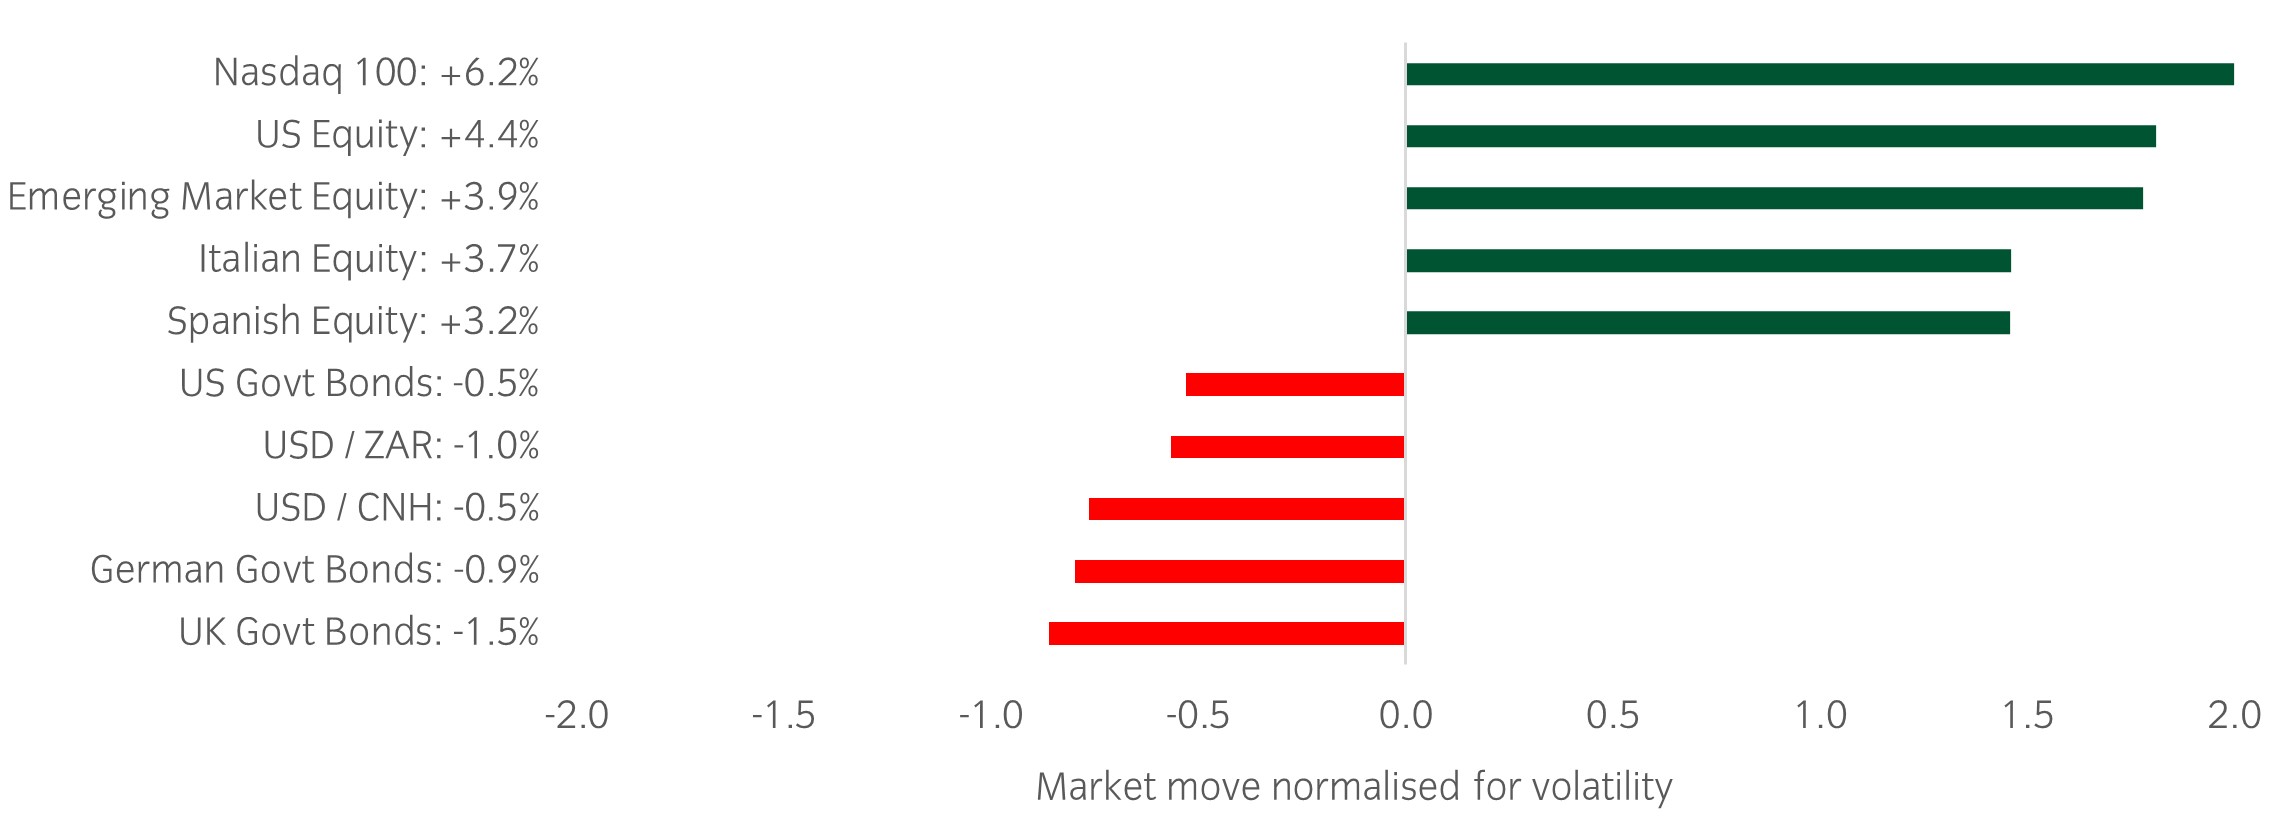
Source: Bloomberg and Insight as at 15 May 2025. The price movement of each asset is shown next to its name. The data used by the bar chart divides the price movement by the annualised historical volatility of each asset.
Winners & losers: US, emerging market, and European equities had strong risk-adjusted returns, while developed market government bonds posted negative risk-adjusted returns.
Over the past week, several things caught our eye:
- Markets rallied after the US and China announced a de-escalation in their ongoing trade war. Both countries reduced their respective tariff rates for 90 days to allow for further discussions to take place. This was a positive surprise for the market, although the final tariff levels across various sectors still need to be negotiated.
- The US House of Representatives Ways and Means Committee released its proposal for tax cuts. Market participants had hoped the bill would offer information regarding both the magnitude of any potential tax cuts and any specific measures designed to offset the tax cuts. The initial tax bill seemed to include less in spending cuts than expected, meaning it is unlikely to reduce the US fiscal deficit.
- Year-on-year US inflation, as measured by the US consumer price index, came out slightly lower than expected, at 2.3% versus expectations of 2.4%. The lower-than-expected print eases pressure on the Federal Reserve (the Fed) offers policymakers more flexibility to reduce its policy rate if necessary. However, the Fed is likely focused on growth and inflation data in the coming months and quarters as the impacts from tariffs and policy uncertainty start to show up in hard economic data.
Asset allocation observation
"Year-to-date divergence between the US dollar and other US assets"
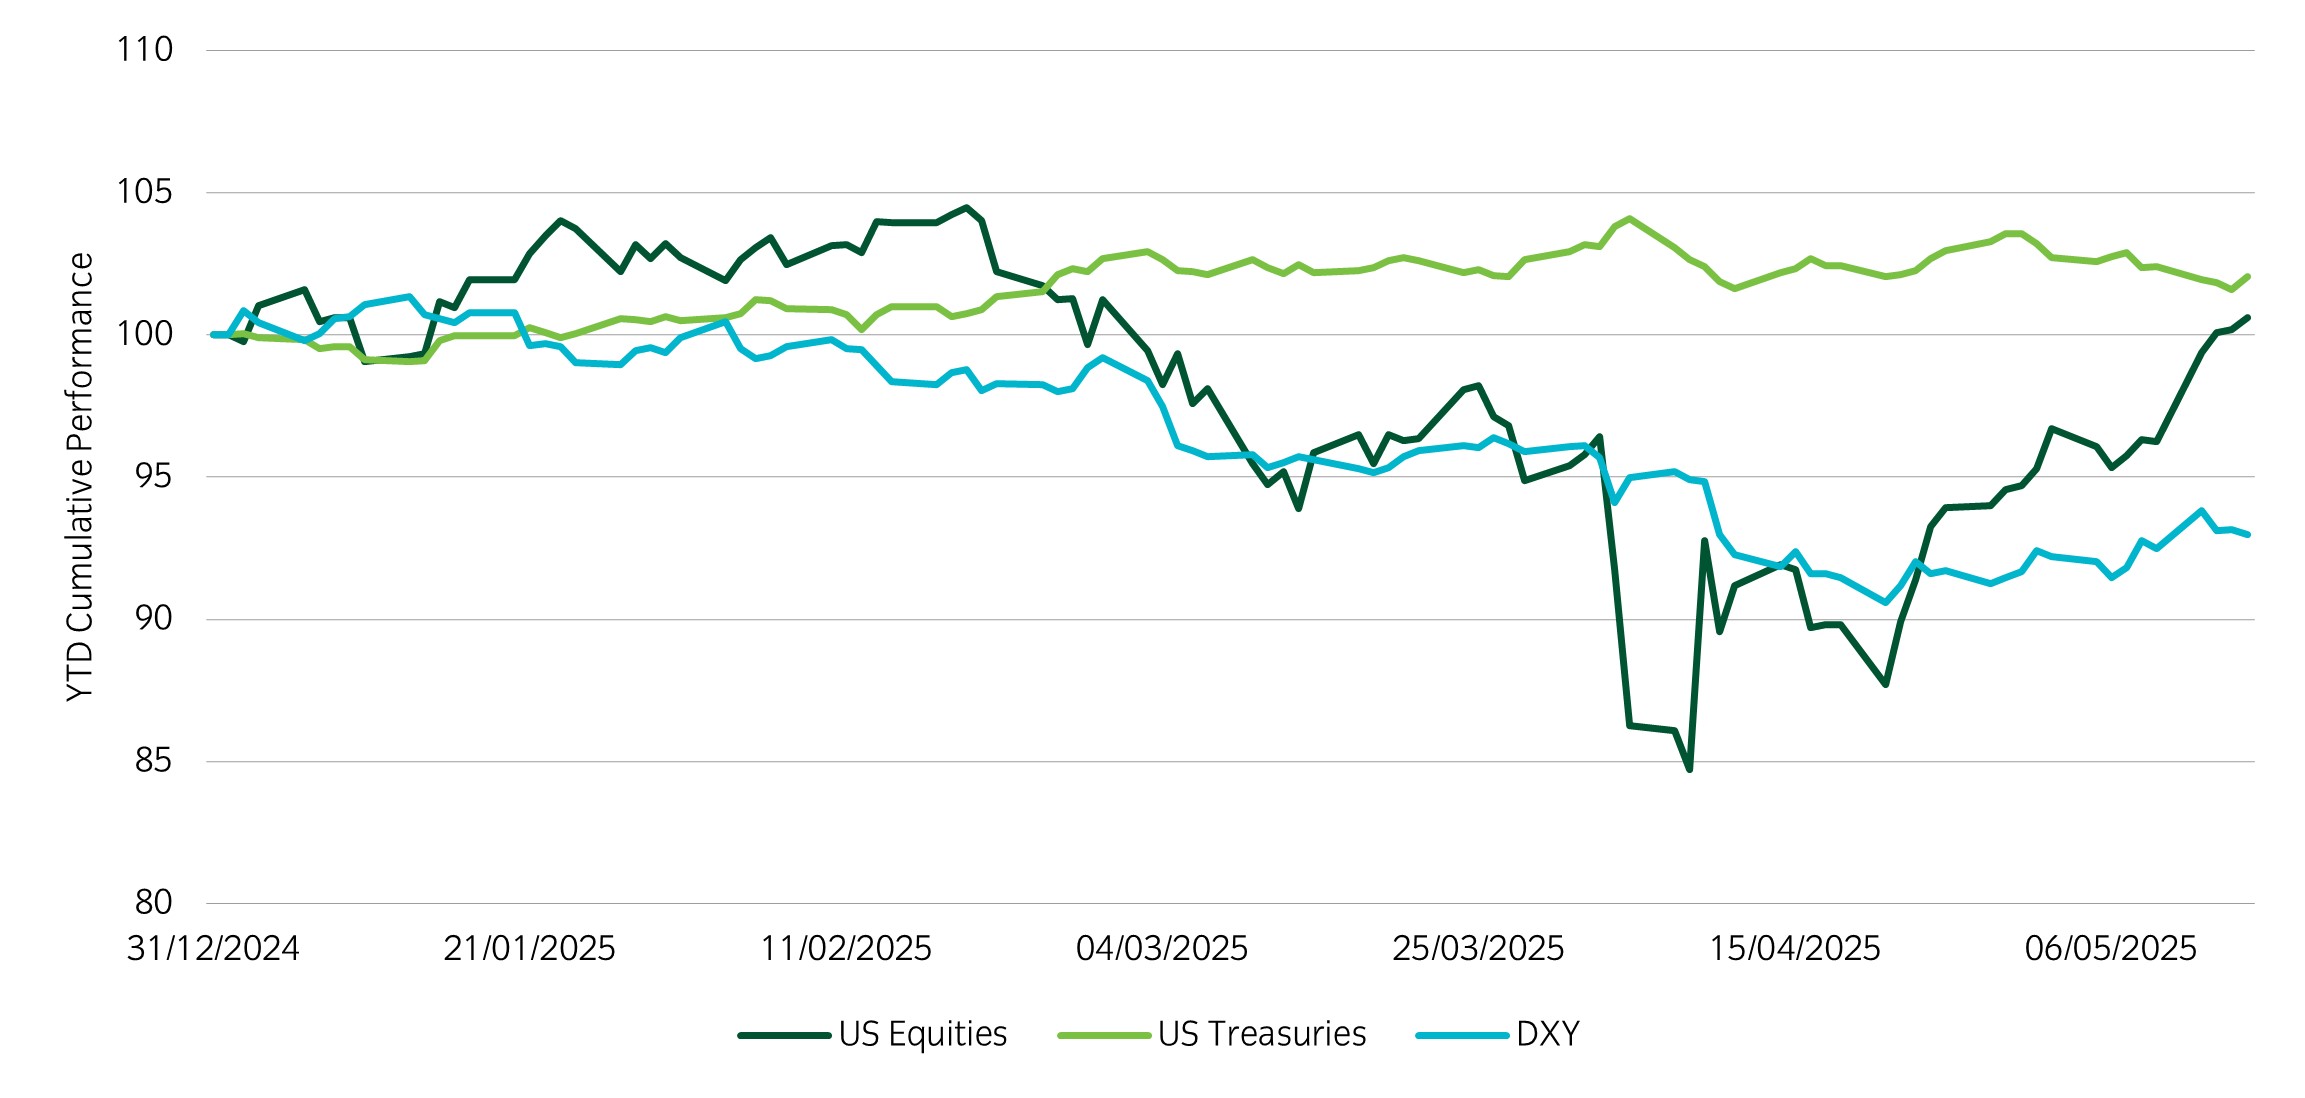
Source: Insight and Bloomberg as at 15 May 2025.
- US equities have exceeded the levels witnessed on 2 April, even surpassing the levels seen at the start of 2025. Meanwhile, US Treasuries have gained year-to-date.
- Despite strengthening after the de-escalation in US-China trade relation, the US dollar has not participated in the recovery enjoyed by US equities. The US dollar remains approximately 7% below its level at the beginning of 2025. Global investors are likely, on the margin, reducing historically high exposure to the US dollar, considering the policy and economic uncertainty in the US. The weaker dollar trend may continue if the outlook for global growth stabilises.
- In our portfolios, we will seek opportunities in both developed and emerging currencies versus the US dollar and currently have higher exposure to duration relative to recent years.
Chart of the week
European manufacturing orders overtake US
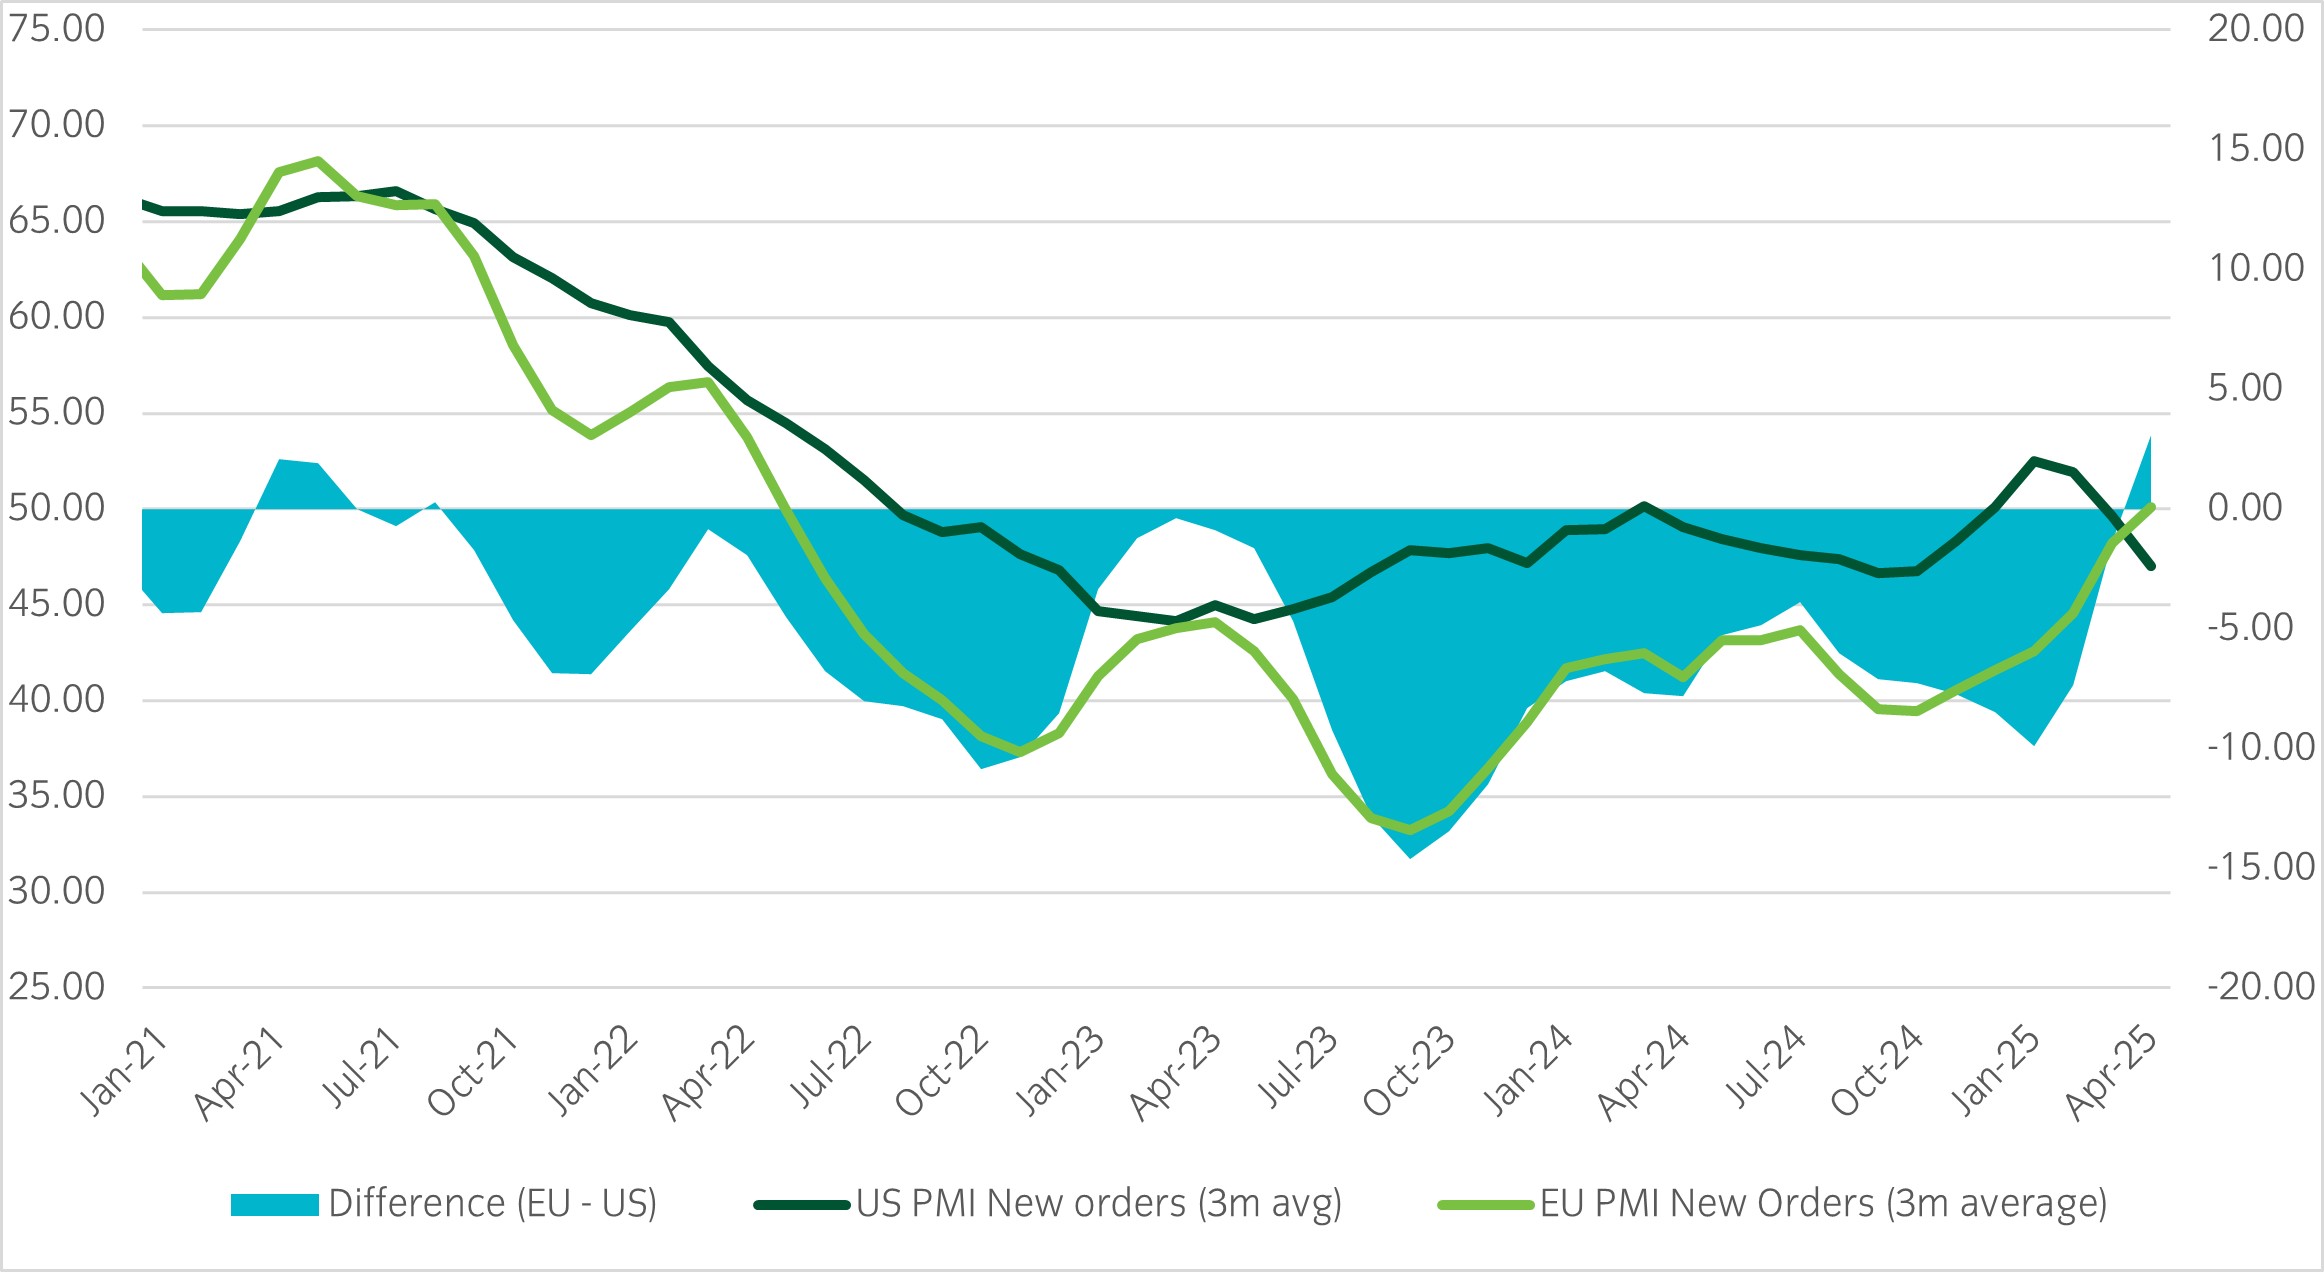
Source: Bloomberg and Insight Investment as at 30 Apr 2025.
- European manufacturing PMI new orders have risen above US manufacturing PMI new orders for the first time since 2021.
- If European data continues in this direction it may support the rotation out of US assets into European assets. Furthermore, this may support the continued outperformance of European equities relative to US equities seen since the beginning of the year.
- Markets will wait for more information from trade negotiations and for policy details out of both Europe and the US. However, global investors will be considering alternatives to their current, relatively high exposure to US assets.
Significant market moves this week
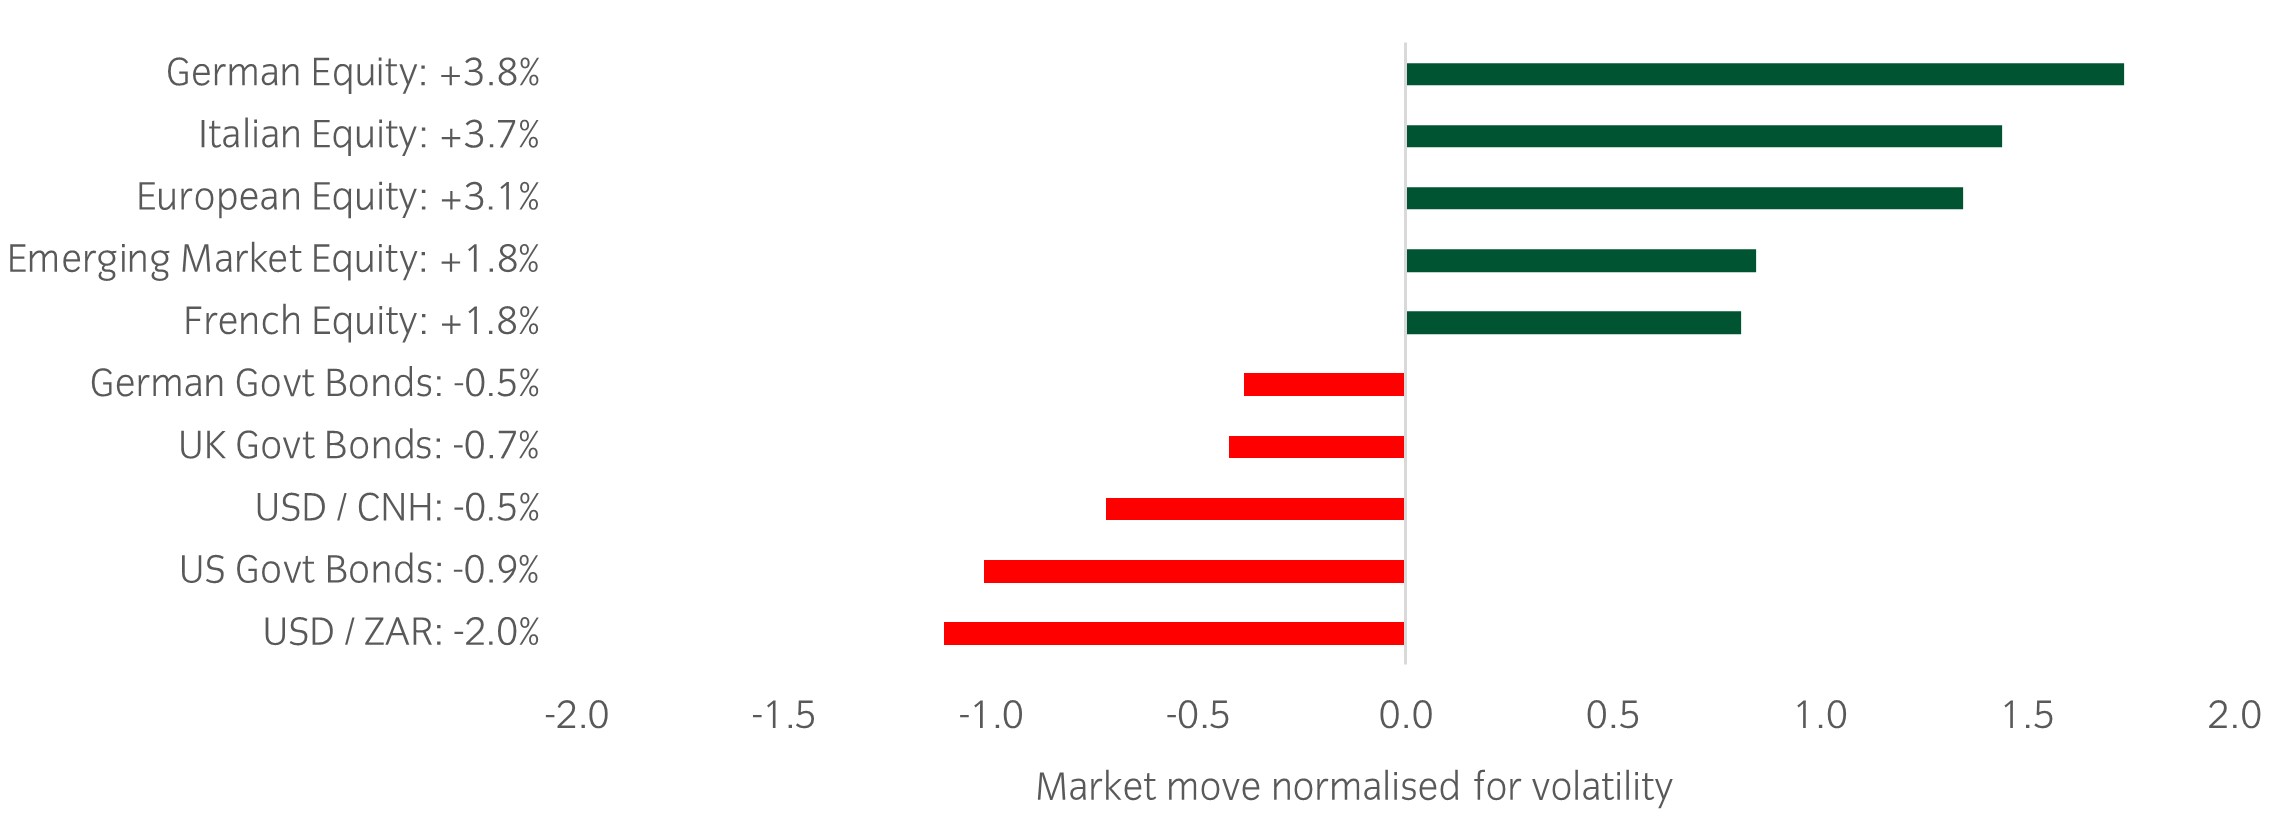
Source: Bloomberg and Insight as at 08 May 2025. The price movement of each asset is shown next to its name. The data used by the bar chart divides the price movement by the annualised historical volatility of each asset.
Winners & losers: European and emerging market equities had strong risk-adjusted returns while US government bonds had negative risk-adjusted returns and the USD fell vs CNH and ZAR.
Over the past week, several things caught our eye:
- Markets rallied on the news that the US and China will meet in Switzerland over the weekend for trade talks. This is the first confirmation of meetings between the trade partners and markets are hoping for a de-escalation in the ongoing trade war.
- Trump announced a trade agreement with the UK – markets perceived this as a positive development and increased hopes for more trade deals as the 90-day window progresses.
- The Federal Reserve held rates steady, citing uncertainty around the path of inflation and growth as the impact of tariffs has yet to hit hard economic data.
- The Bank of England cut rates by 0.25% to 4.25%, the lowest since May 2023. This rate cut was expected amidst weak economic growth; the UK 10 year gilt yield has risen 0.15% since the announcement.
Asset allocation observation
USD continues to weaken
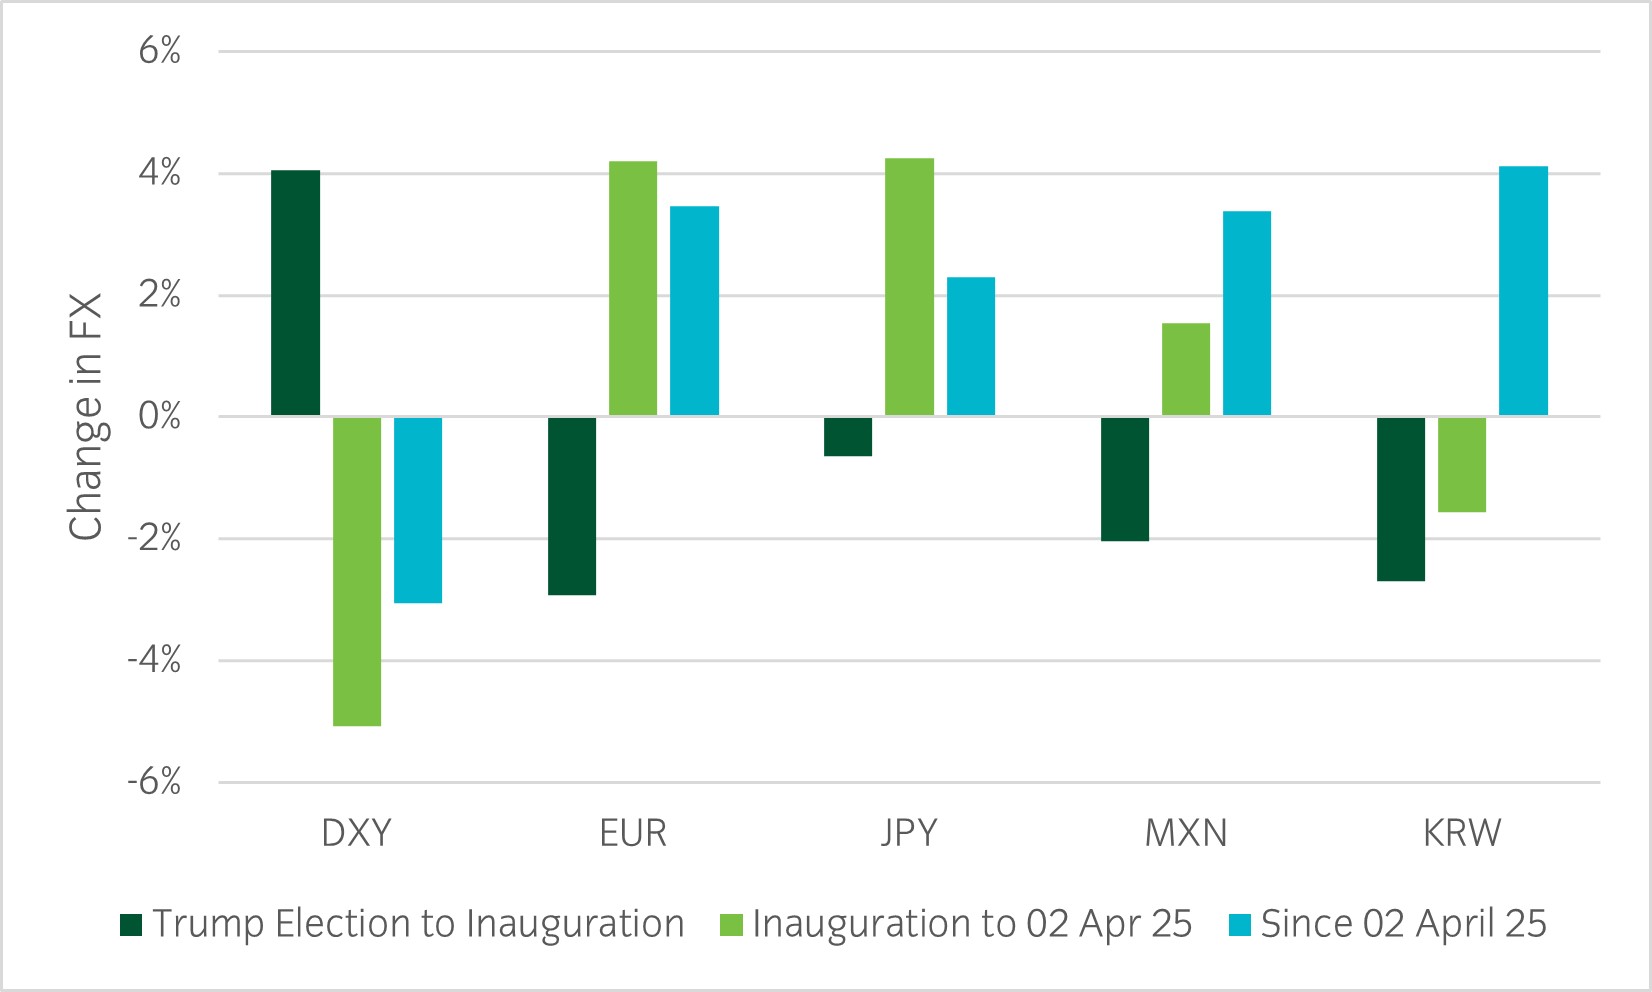
Source: Insight and Bloomberg as at 08 May 2025.
- Currency volatility increased massively after Trump’s tariff announcements on 2 April. The US dollar has been weakening against not only safe-haven currencies such as JPY but also historically riskier currencies such as MXN and other emerging market currencies.
- This weakening in the US dollar is a continuation of the trend seen since Trump’s inauguration in January. Global investors continue to be concerned about US policy uncertainty and a reduction in ‘US exceptionalism.’ Furthermore, positioning in the US dollar and exposure to unhedged US assets had reached historical highs.
- In our portfolios we have reduced US dollar exposure and will be looking for opportunities in emerging market currencies.
Chart of the week
Most US households expect business conditions to worsen
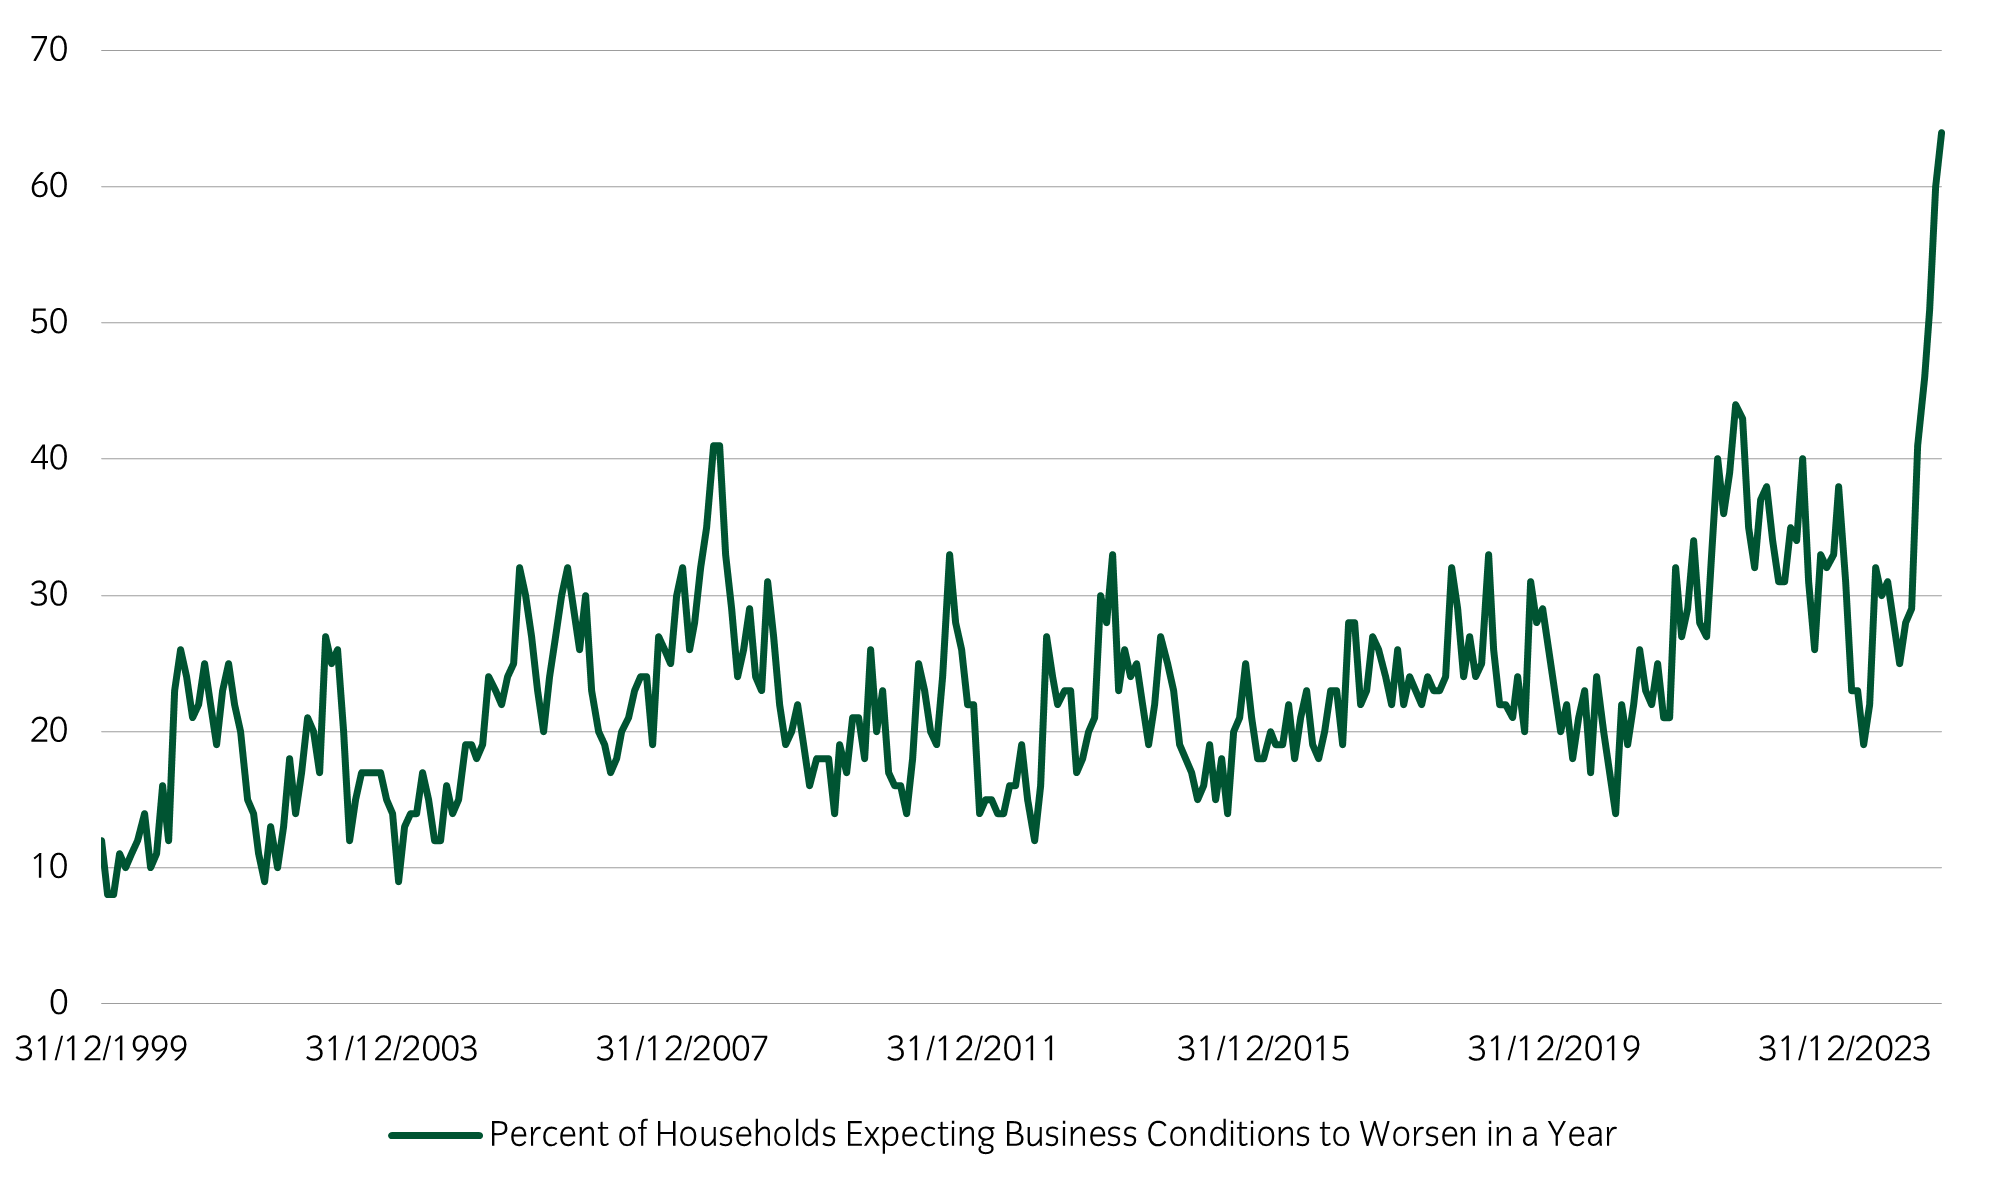
Source: Bloomberg and Insight Investment as at 27 Apr 2025.
- A survey of US households by the University of Michigan shows sentiment has deteriorated sharply since Trump’s tariff announcements; 64% expect business conditions to worsen in a year.
- This is the most negative result in the survey’s history since 1978.
- Negative sentiment around business conditions may foreshadow worsening hard economic data in the coming weeks and months, as uncertainty persists and the impacts from the tariffs start to materialise.
Significant market moves this week
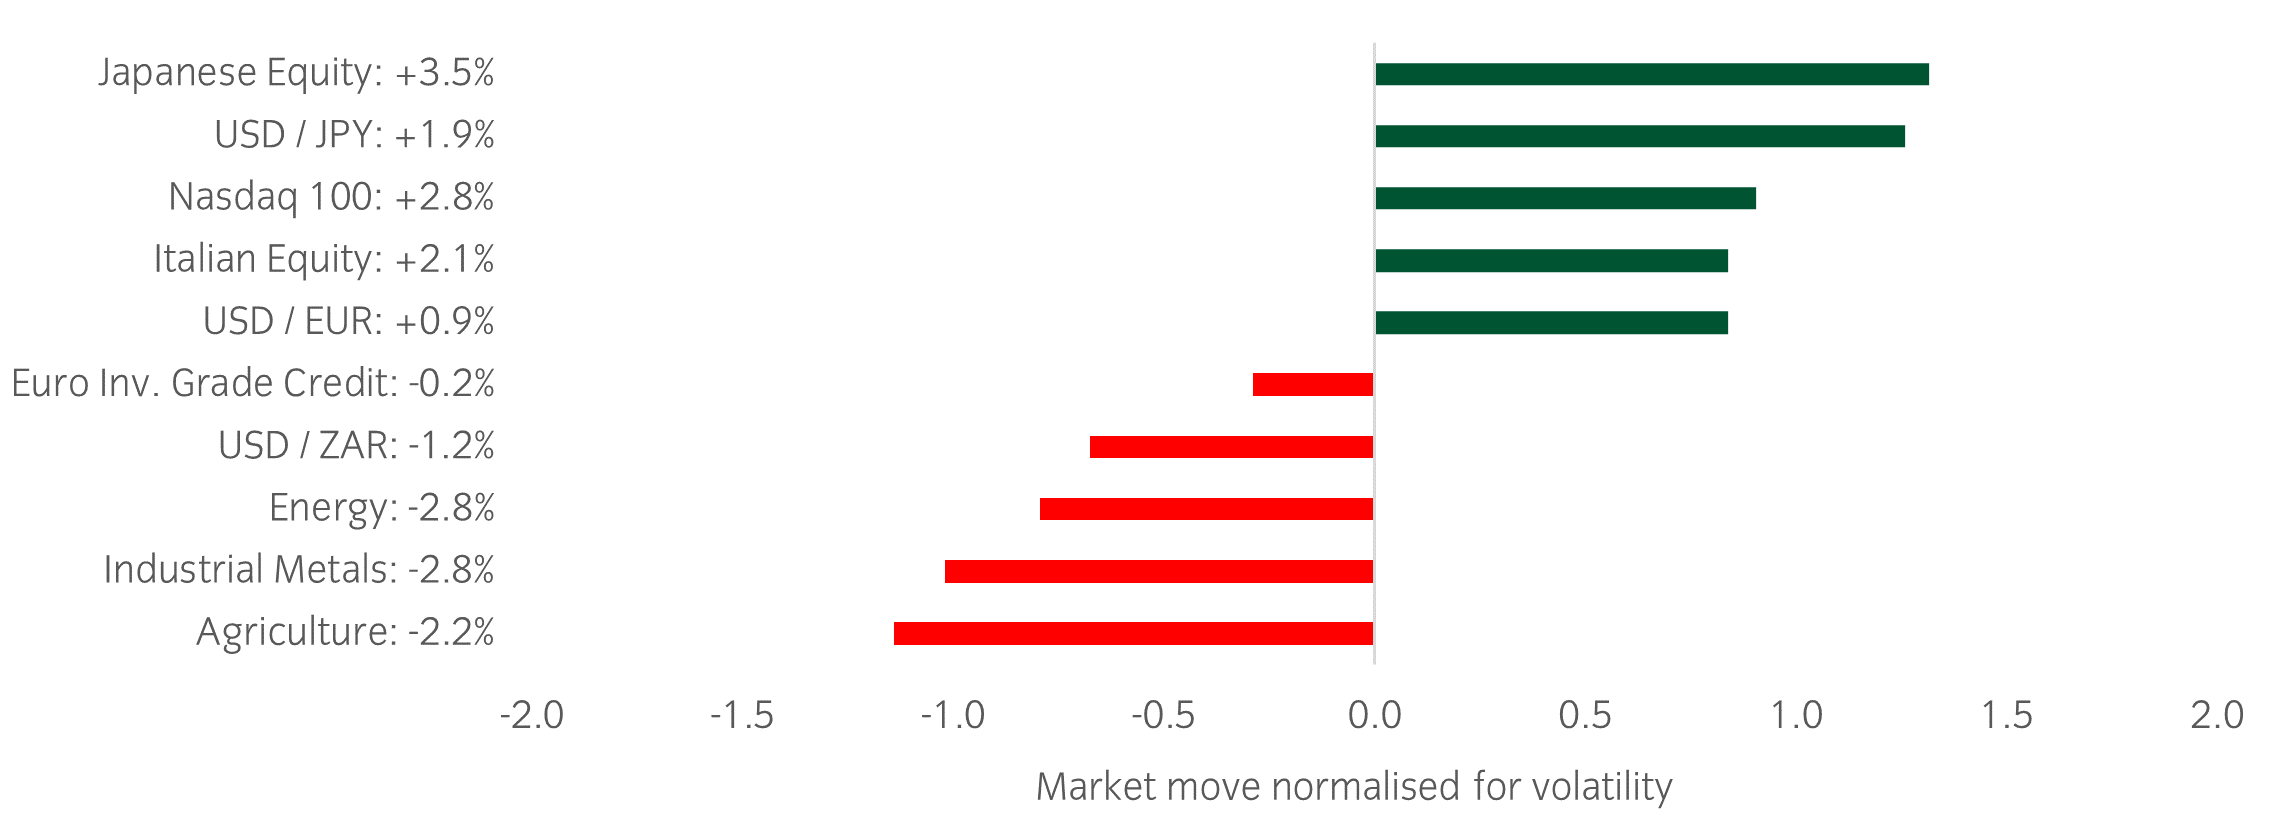
Source: Bloomberg and Insight as at 01 May 2025. The price movement of each asset is shown next to its name. The data used by the bar chart divides the price movement by the annualised historical volatility of each asset.
Winners & losers: Japanese equities and US tech stocks gained, while commodities suffered some of the largest negative risk-adjusted moves.
Over the past week, several things caught our eye:
- The market was relatively calmer this past week compared to the weeks following the 2 April tariff announcements. US equities achieved the largest 8-day gain since November 2020, when vaccines were finally made available during the covid pandemic, returning 8.7%. The market is becoming more optimistic around progress in trade talks between the US and China, and hopeful of the US finalising additional trade deals with its other main trading partners.
- Earnings season continued in earnest: Microsoft, Meta, Apple, and Amazon announced results, with bellwether companies such as Caterpillar, Visa, Eli Lilly, and Mastercard also reporting. The US tech sector rallied due to better-than-expected results from the likes of Meta and Microsoft. Most companies recognised the potential impact of tariffs but struck a balanced, rather than very pessimistic, tone regarding the economic outlook.
- The US dollar rallied and haven currencies such as the Japanese yen, Euro, and Swiss franc have given back some of their gains since 2 April as volatility has reduced.
- The Bank of Japan held rates constant as expected but cut its growth forecasts, given the uncertainty around US tariffs and their impact on Japanese exports, contributing to weakness in the Japanese yen over the week.
Asset allocation observation
Government bond yield curves continue to steepen
Source: Insight and Bloomberg as at 01 May 2025.
- Yield curves in both the US and Europe continued to steepen in recent weeks. The market has been pricing in growth concerns in the US and pricing in higher probabilities of rate cuts by the Fed in 2025. The short ends of yield curves have fallen by a larger magnitude compared to the longer ends of the yield curves, leading to steeper curves.
- Within our portfolios, we have a steepener exposure in both the US and Europe. We have recently trimmed some of the US steepener exposure, but we expect the longer-term steepening trend to continue, due to the macro backdrop.
Most read
Global macro, Currency

June 2023
Global Macro Research: 30 years in currency markets
Global macro

January 2022
Global Macro Research: Asset allocation, growth and inflation cycles
Global macro, Fixed income

October 2023
Global Macro Research: Yield-curve inversion – an unreliable recession signal?
Fixed income

January 2025