 United States


April 13, 2023
Fixed income
Headline inflation continued its downward momentum, slowing to 5.0% year-over-year in March, down from 6% in February, its lowest level since September 2021. Core inflation ticked up to 5.6%, led by continued strength in the shelter category.
Core services categories are still peaking
Core services continued to run relatively strong, with shelter once again the largest contributor. Other categories with large increases included air fares (17.7% year-on-year) and motor vehicle insurance (15%). Importantly, however, the Fed’s closely-watched “supercore” category (services excluding shelter) decelerated from 6.1% to 5.8%.
Figure 1: Most areas are cooling, but we need to see more deceleration in core services (% year-on-year)
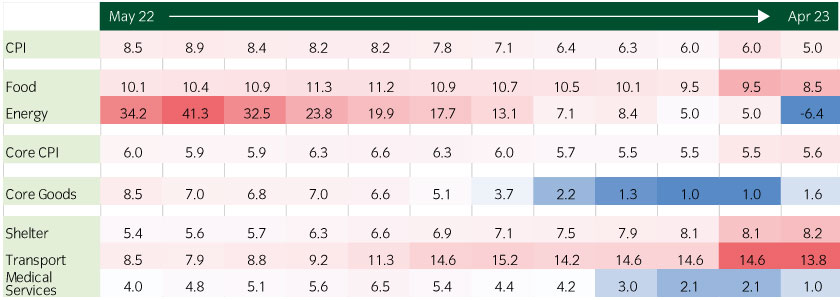
Source: Bureau of Labor Statistics, April 2023
Energy CPI fell the most, but OPEC production cuts pose a risk
Energy CPI was the largest negative contributor this month, with base effects and warmer weather as major drivers. Over the medium term, however, this trend may be upended as OPEC+ unexpectedly announced further production cuts of over 1.5 million barrels per day, in addition to the cut of two million barrels announced in November 2022 (Figure 2).
Figure 2: OPEC recently announced production cuts to support oil prices
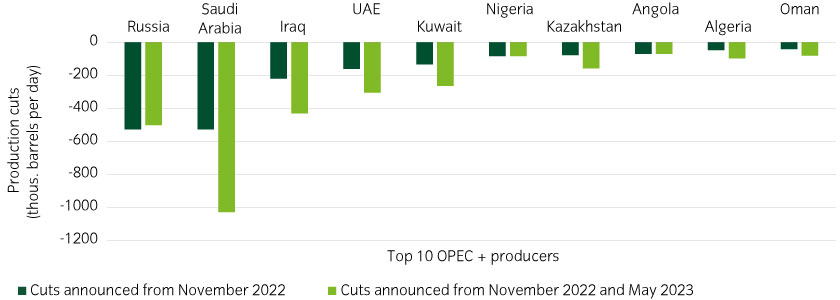
Source: OPEC, Bloomberg, April 2023. Production cuts are relative to production levels announced August 2022: https://www.opec.org/opec_web/en/press_room/7120.htm
Labor market indicates a wage-price spiral is less likely
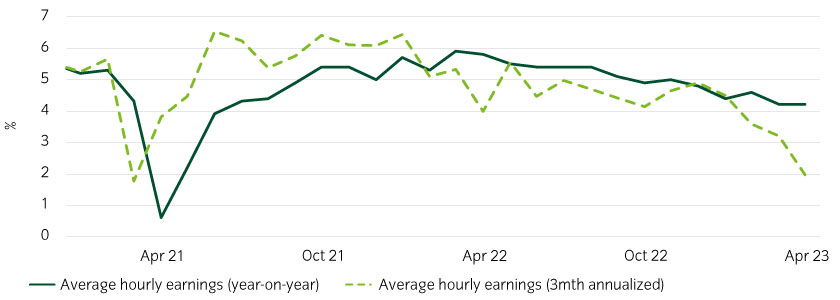
There are finally signs that the Fed’s policy is loosening labor market conditions. For example, job openings fell to the lowest level since May 2021, and the pace of job creation has moderated over several months. This is having a knock-on effect on wage growth, which is running at the slowest level since June 2021. Momentum, measured by the 3-month annualized rate, is also slowing (Figure 3).
Figure 3: A wage-price spiral may be less likely
Source: NFIB small business survey, March 2023. https://www.nfib.com/surveys/small-business-economic-trends/
Goods prices are continuing to slow or reverse
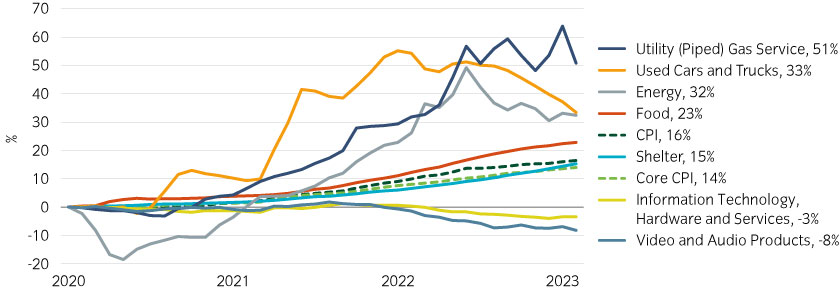
The start of the pandemic was marked by price declines until consumers adapted to the new reality and supply-chain disruptions led to major spikes in goods prices. Lately though, some of those areas have reversed course, leaving services categories in focus (Figure 4).
Since January 2020, the Consumer Price Index has risen by 16%, led by autos (due to semiconductor shortages and logistics disruptions), food prices (labor shortages, higher fertilizer prices), and energy categories. We expect further relief in some of these areas.
Figure 4: Areas with the strongest price rises have been reversing lately
Source: Bureau of Labor Statistics, April 2023
An encouraging report for the Fed, but its job is not quite done
Overall, CPI inflation is continuing to move in the right direction, and recent developments in the labor market look encouraging, although energy prices remain a risk.
For now, we expect the Fed to raise the policy rate one more time at its next meeting in May and then hold it steady to allow for the lagged effects of its hikes to work through the real economy.